
Apple Search Ads share of voice: why the top 50 auction positions matter
Tracking only the ads visible in the App Store misses an estimated 22% of impressions. Accurate Apple Ads SoV starts with the full competitive queue and is essential for campaign optimization.
Research by APPlyzer | US App Store | Updated 21 July 2026
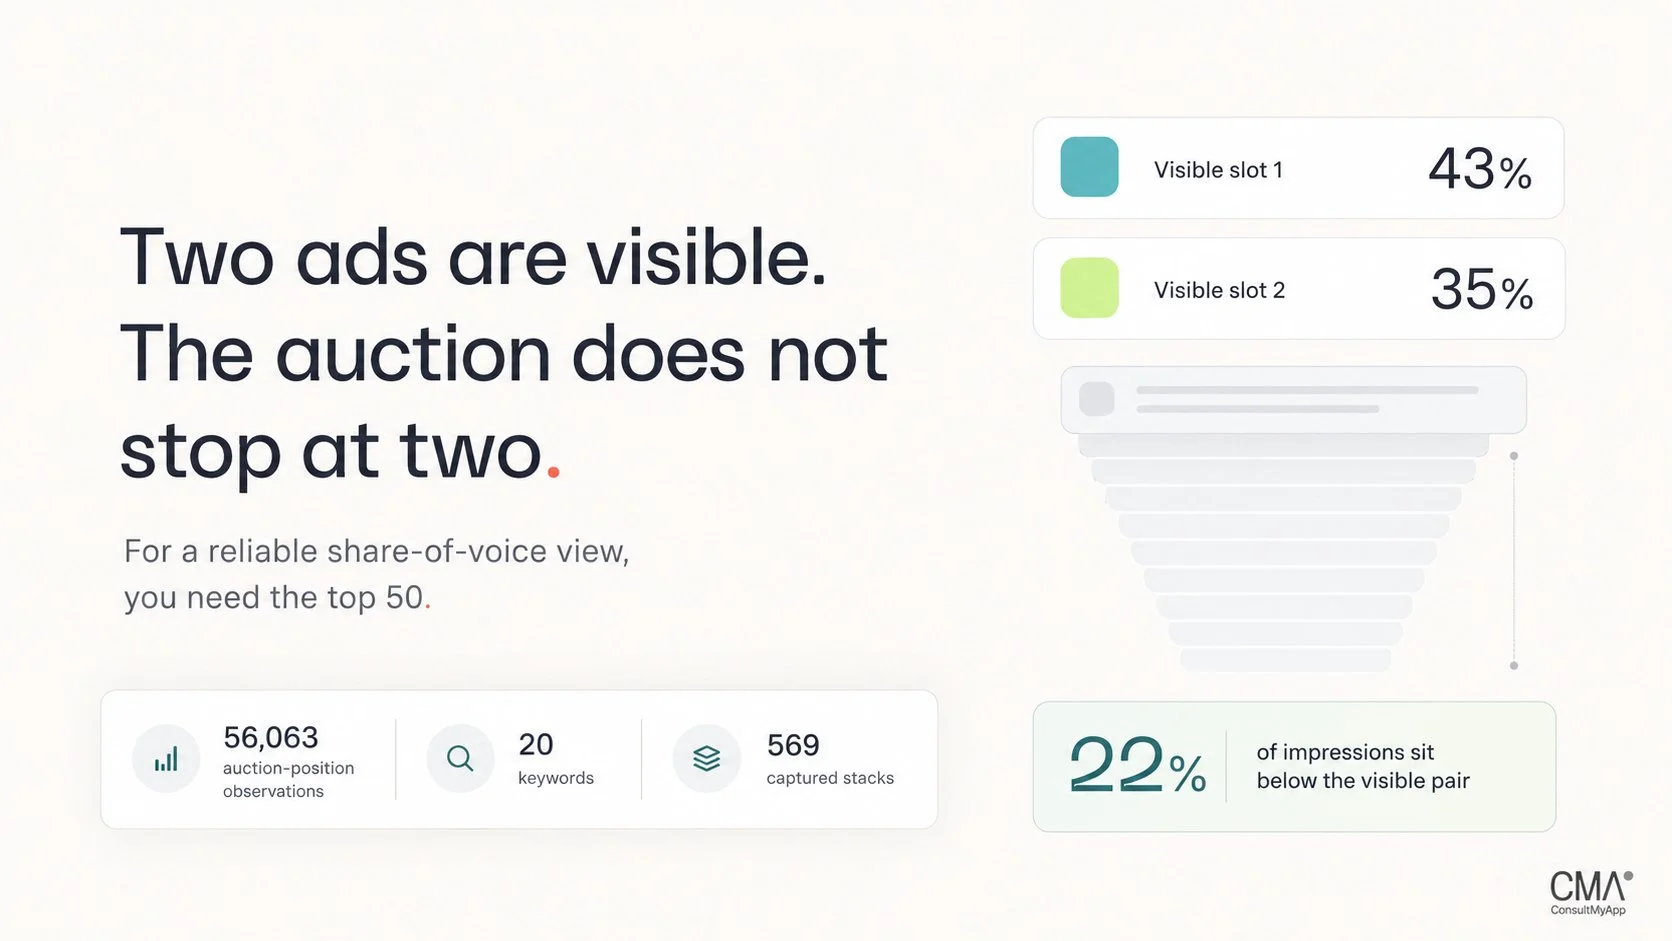
APPlyzer's Apple Search Ads share-of-voice model is based on 56,063 auction-position observations from 569 captured auction stacks across 20 popular US App Store search terms. The keyword set is concentrated rather than exhaustive, but the curve remained materially stable when the study grew to incorporate additional keywords; 554 auction results each contained at least 90 ranked apps. More categories may improve coverage and tighten the estimates, but we do not expect them to change the central finding: an accurate Apple Ads SoV view requires the top 50 apps in the auction, not just the one or two ads visible in a single scan every few hours.
What is Apple Search Ads share of voice?
Apple Search Ads share of voice (SoV) is the estimated percentage of App Store search-results ad impressions won by an app for a particular keyword, country and period. Apple renamed Apple Search Ads to Apple Ads in 2025, but marketers still use Apple Search Ads, ASA and Apple Ads SoV interchangeably. The important word is impressions. A device screenshot tells you which sponsored apps appeared to one user at one moment. Share of voice asks the market-level question: across all eligible impressions, which apps were shown, and how often? Measuring SoV from the visible winners alone is a bit like photographing the first two runners in a marathon once an hour and deciding everyone else has gone home. Our central position-based model assigns a maximum of roughly 43% total impressions to auction position 1, 35% to position 2 and 22% across positions 3-100. The leading pair still owns most of the market (esp. if they hold onto those positions), but more than one in five impressions is captured by apps that actually surface below them.
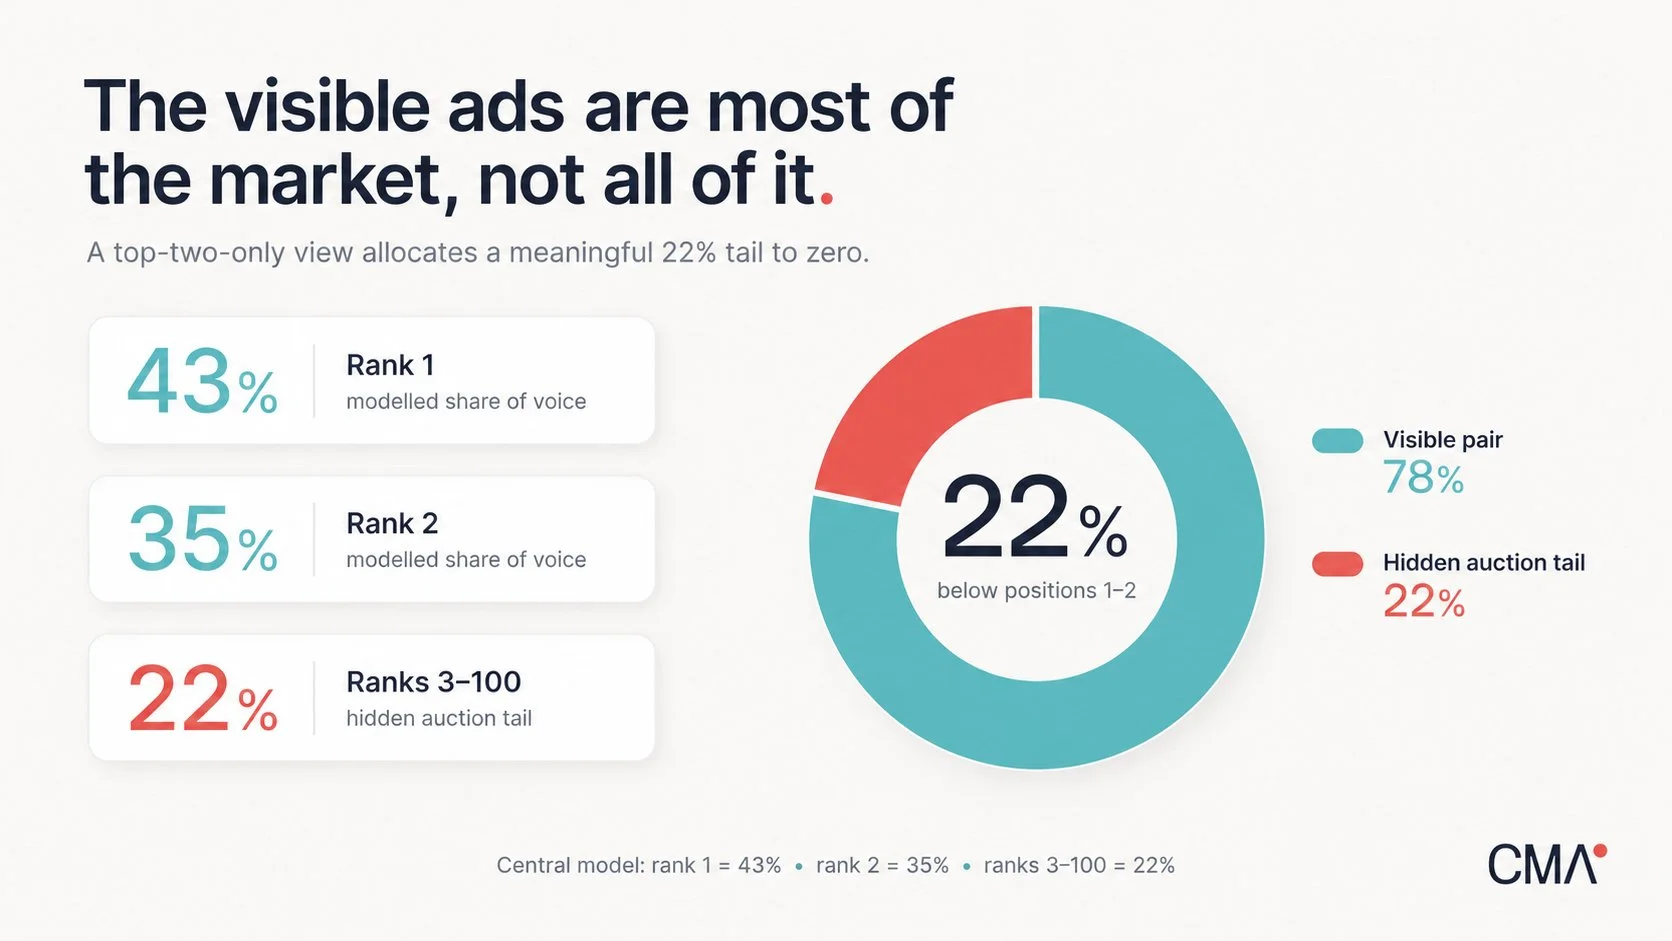
APPlyzer's central Apple Ads SoV curve assigns 78% to positions 1-2 and 22% to positions 3-100. Source: APPlyzer central share-of-voice model.
If you only track the ads visible in the App Store, you are measuring screen presence, not the full Apple Search Ads market. Accurate SoV needs the top 50 auction positions.
Why do apps below auction position 2 receive impressions?
Because auction position is not a permanent seat number. It is a queue that moves by user, time and campaign conditions. An app ranked 17th in one capture can still surface in an available ad slot for another user or in the next hour. Apple says search-results ads can appear at the top of results or further down the page, and that whether one advertiser displays over another depends on relevance and keyword bid. Advertisers cannot select or bid for a specific position (see Apple Ads search-results documentation).
Apple doesn’t publish the full delivery recipe, so the exact reason a lower-ranked app receives a particular impression remains private; however in part this will be due to users that have already seen the other ads more than twice, already clicked on other ads, potentially have the app installed already and of course dynamic changes to bids (and even relevance following app updates).
The movement in the stack, however, is observable. Across 53,384 app-to-app rank transitions, an app in positions 3-5 appeared in the top two at the next snapshot 12.9% of the time. The rate fell to 1.24% for positions 6-10, 0.225% for positions 11-20 and 0.050% for positions 21-50. Even positions 51-100 produced 10 next-snapshot top-two appearances. Tiny is not zero.
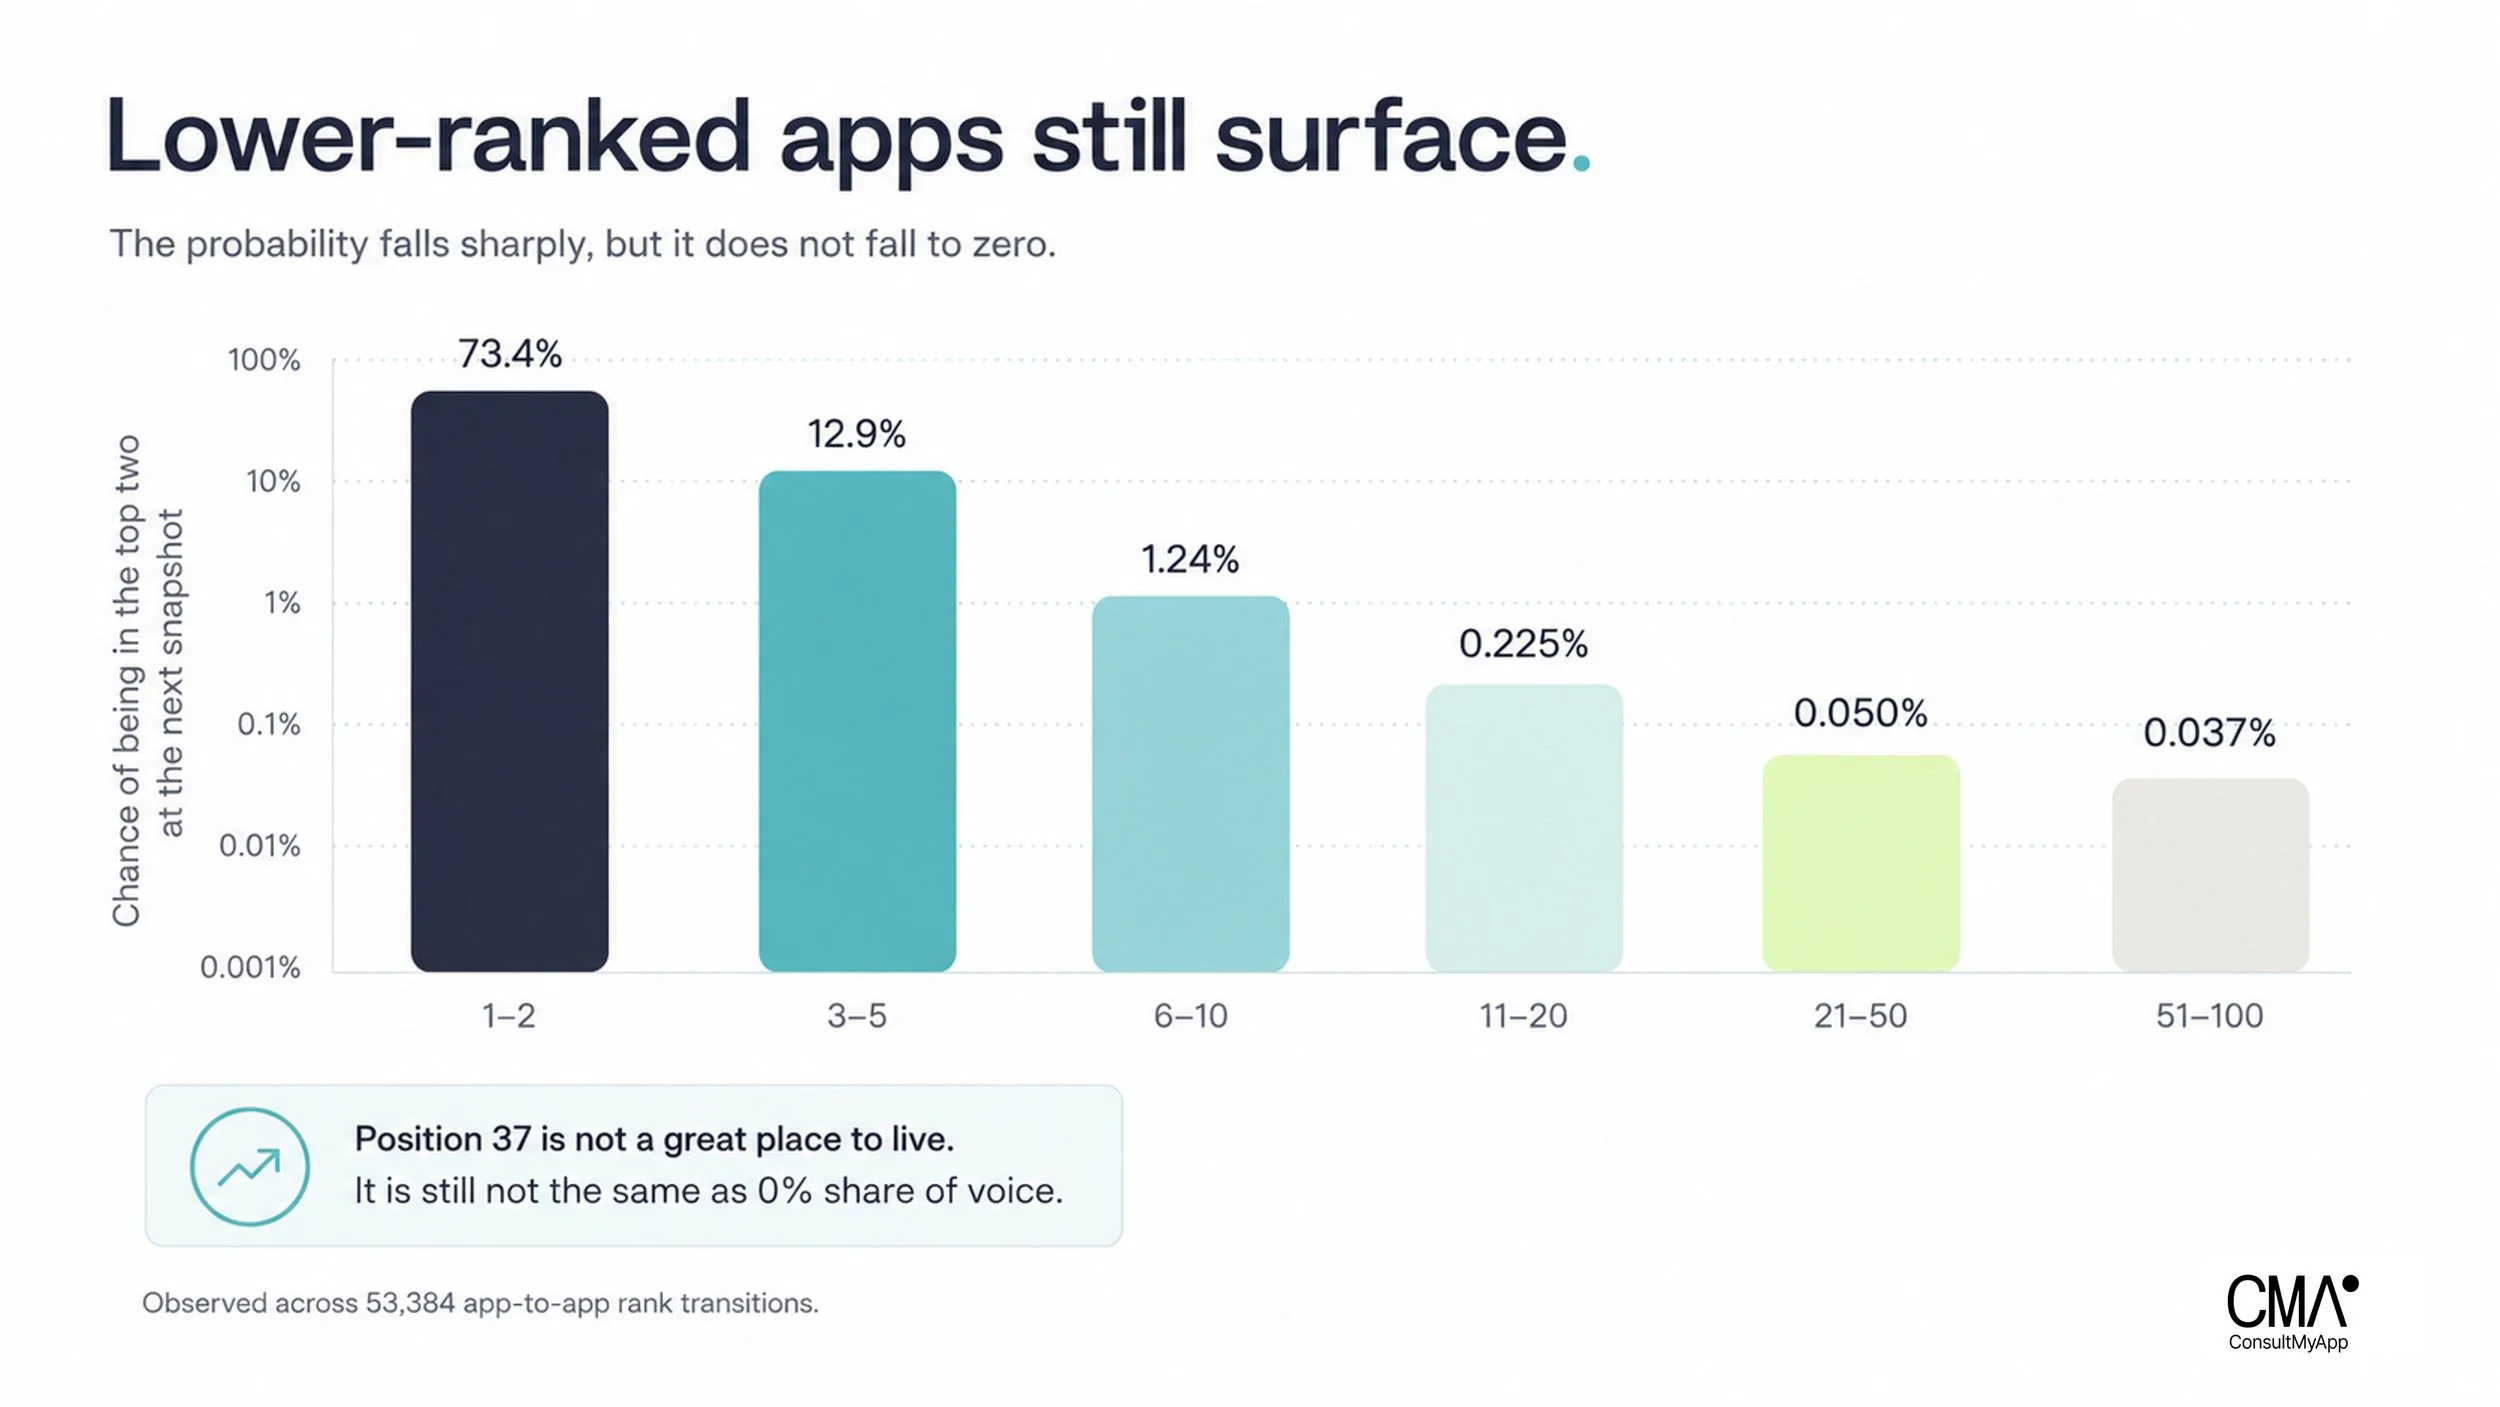
Lower auction ranks do surface: the probability falls sharply, but it does not fall to zero. Source: 53,384 observed rank transitions.
How many auction positions do you need for accurate Apple Ads SoV?
At least 50. That is the practical threshold in this dataset, because it captures the meaningful competitive set without pretending the final reserve positions carry the same weight as the leaders.
Between adjacent snapshots, only 73.4% of the top-two advertiser set stayed the same. Retention rose to 81.9% for the top 20 and 90.1% for the top 50. Expanding from the top 20 to the top 50 bought another 8.2 percentage points of stability. Expanding from the top 50 to the full 100 stack bought only another 2.2 points.
Top 50 is not a magic number handed down on a stone tablet. It is the depth at which the market view becomes materially stable. If you need early competitor discovery, keep the full 100. If you need reliable share of voice from your data platform, don’t stop at 2, 5, 10 or 20.
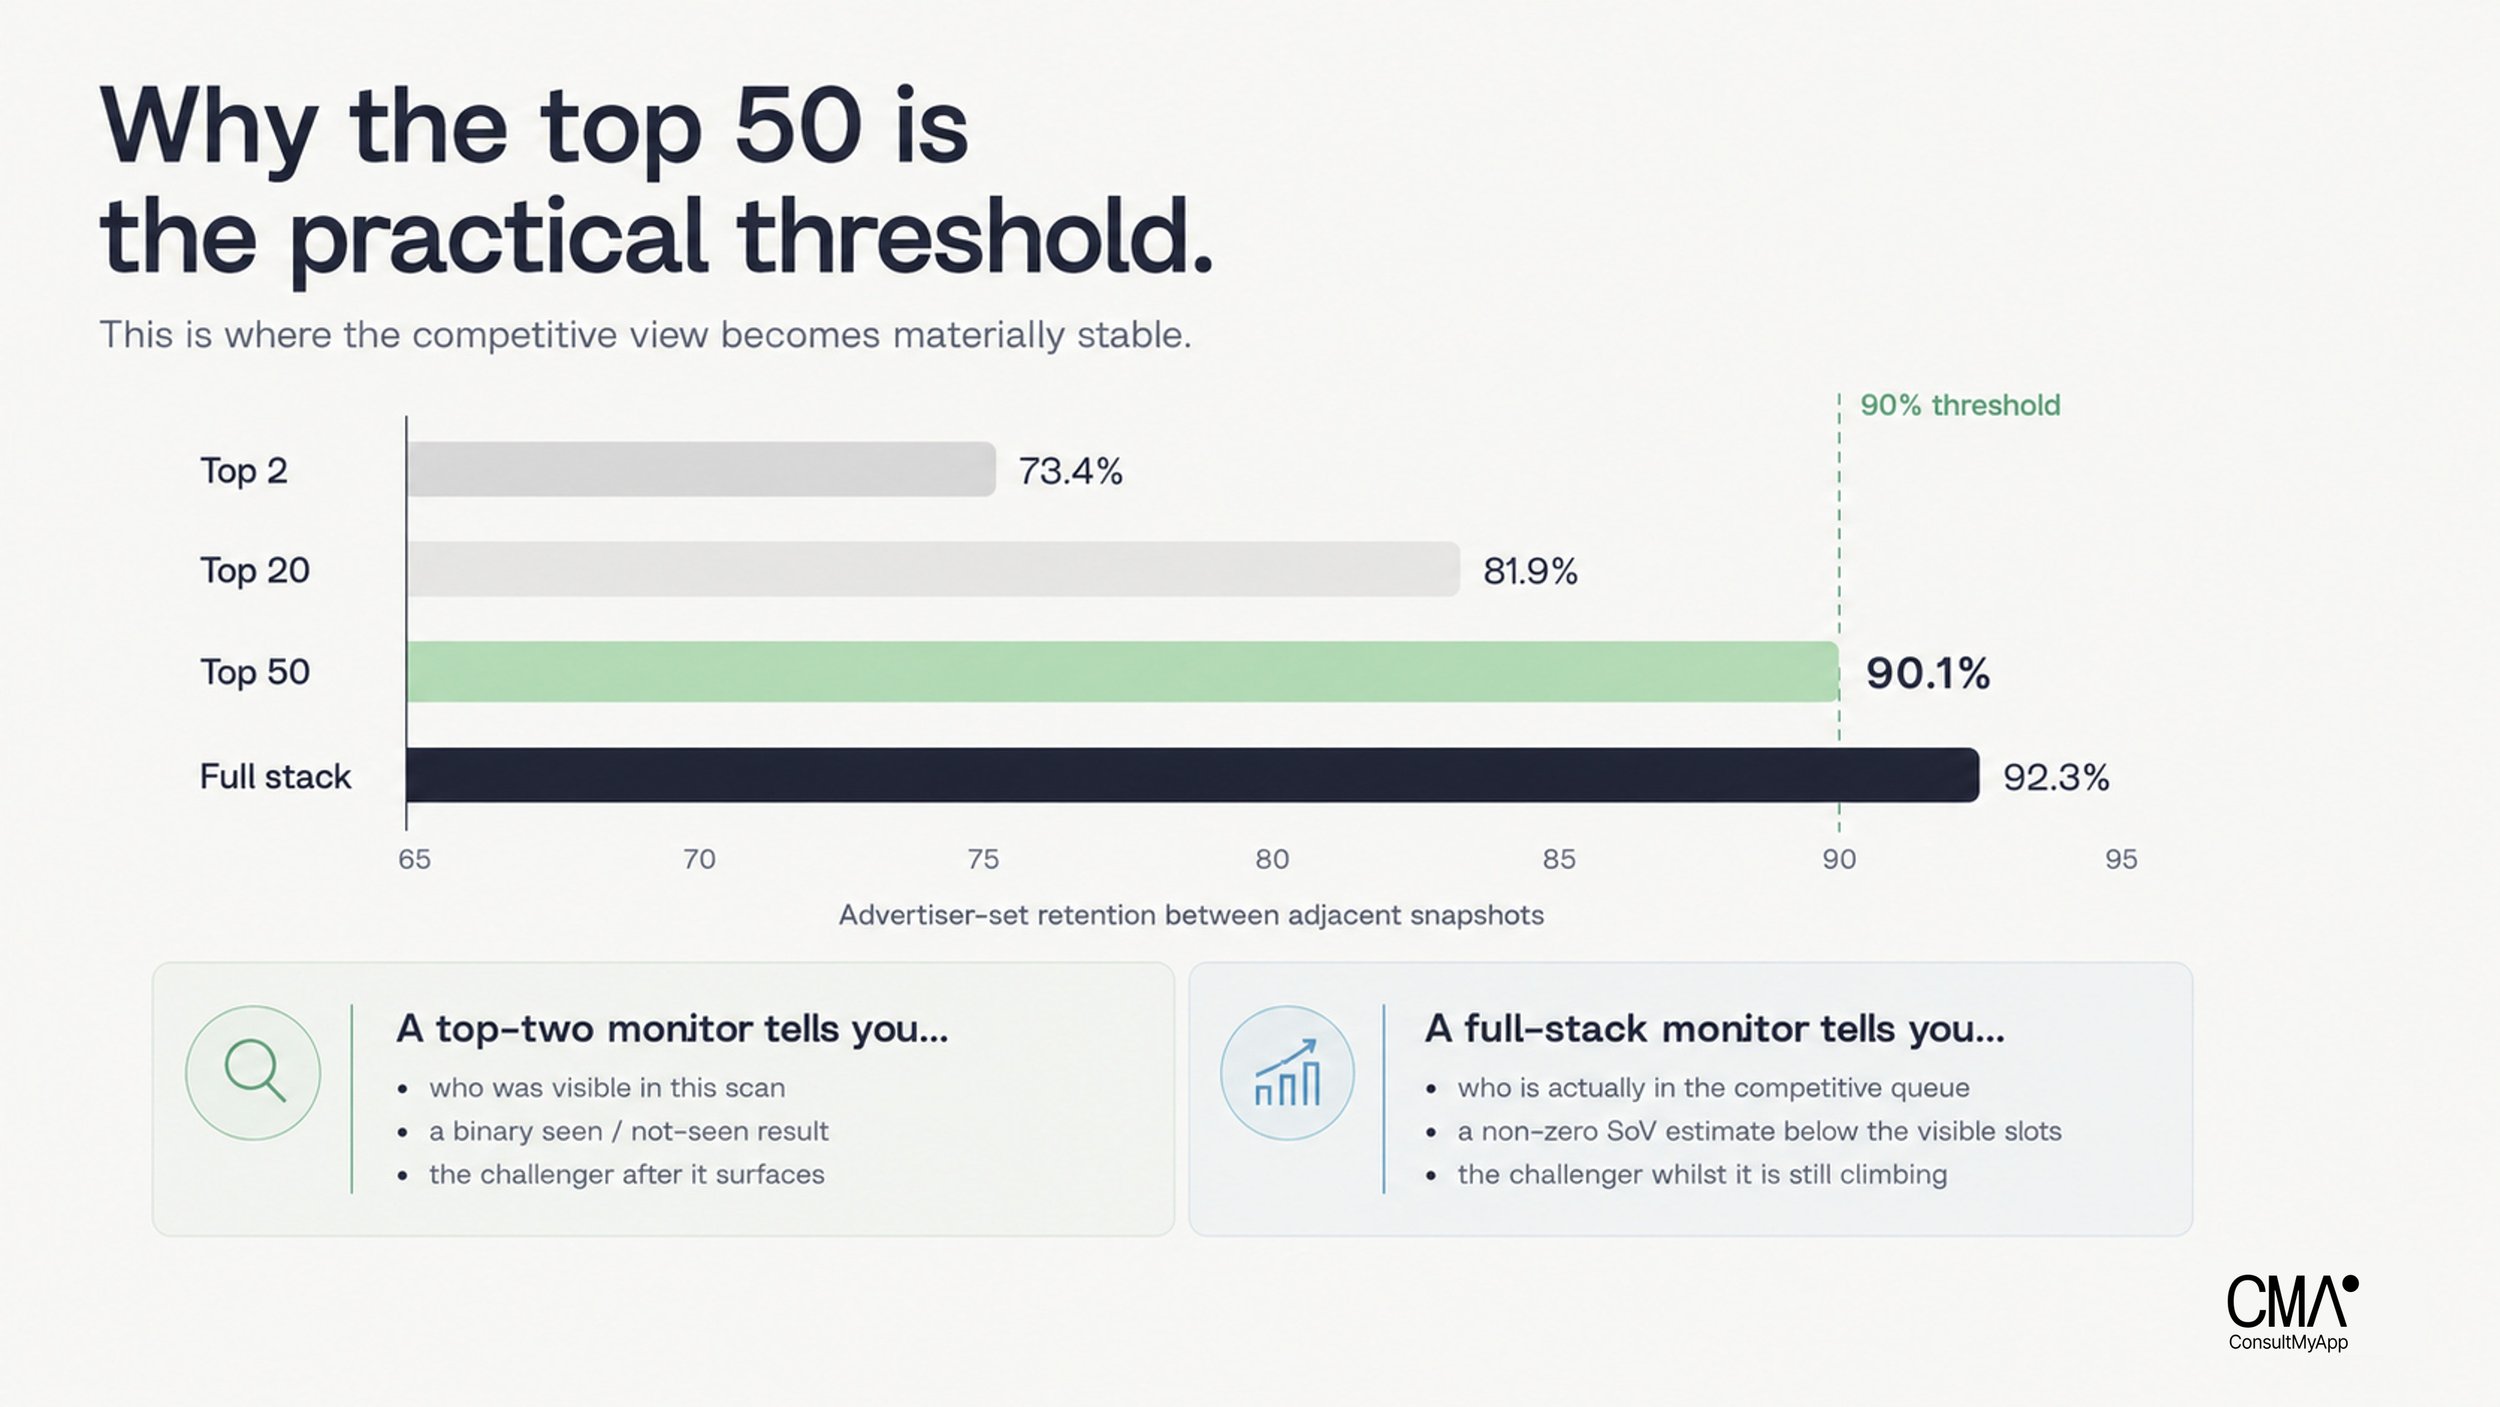
The competitive set becomes materially stable once an Apple Ads SoV tool can see the top 50. Source: APPlyzer adjacent-stack analysis.
What a top-two only Apple Search Ads SoV report gets wrong
The visible positions are not unimportant. Our model assigns them roughly 78% of impressions, so they are extremely important. The error is treating 78% as though it were 100%, as many data suppliers currently do; this creates a massively misleading picture for your campaigns.
When the missing 22% is forced onto whichever apps happened to be visible, the leaders are overstated, fragmentation is understated and challengers are discovered late. A tool can be perfectly accurate about the device screenshot and still be wrong about the market.
An app moving from rank 30 to rank 6 may still be absent from a basic device screenshot view, but its bid, relevance or campaign priority has already changed. By the time it shows regularly at the front, the strategic move is old news.
Apple Ads share-of-voice example: the keyword 'casino'
At 04:45 UTC on 17 July 2026, the keyword 'casino' showed Cider Casino and CrownCoins Casino in the two visible positions in our capture. A conventional SoV monitor could stop there. The full stack had McLuck third, Lavish Luck fourth, Gleaming Slots fifth and dozens more advertisers behind them.
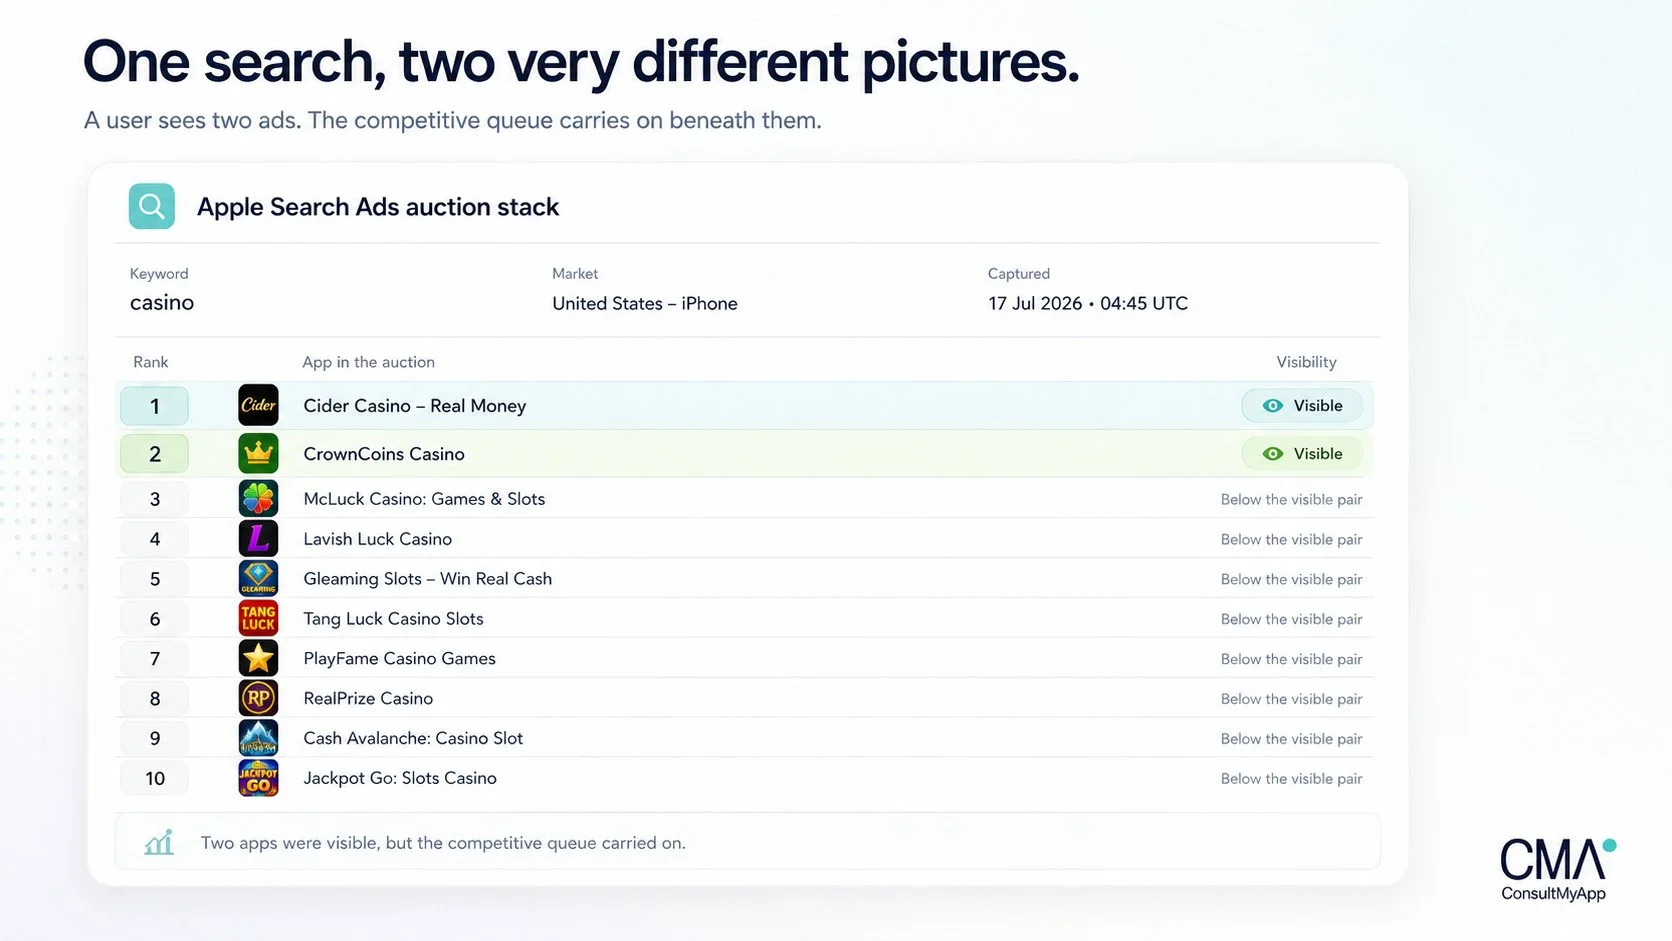
The 'casino' keyword in APPlyzer: two visible ads, followed by a much deeper Apple Ads auction stack. Source: APPlyzer full-stack data, 17 July 2026.
Repeat that across 569 stacks and follow every app through time. You are no longer counting device screenshots; you are estimating the probability that each auction position receives delivery. That is the fundamental material for an accurate Apple Ads share-of-voice curve.
How APPlyzer calculates Apple Search Ads share of voice
APPlyzer starts with the full auction, not a device screenshot. For each keyword and timestamp, it records positions 1-100, measures how ranks move between observations and models the steep fall in delivery from the visible head into the non-zero tail.
Look at positions 1 and 2 and you have a screenshot from a device. Look at the top 50 and you can actually see the market.
That is the difference between visibility monitoring and market intelligence. The full stack shows who is competing now, who is climbing and how fragmented the keyword really is - before the change becomes obvious in the visible ad slots.
How accurate is the APPlyzer Apple Ads SoV model?
The model uses established analytical techniques and is backed by data (it’s based on a large number of real observations), but it’s not omniscient. Apple does not provide delivered-impression logs for hidden auction positions, so the 43% / 35% / 22% split is a central estimate, not Apple-published data. It combines observed rank dynamics, the visible-slot structure and prior research into comparable ad-auction systems.
The completed 24-hour dataset strongly validated the shape: a steep head, a meaningful non-zero competitive tail and a tiny reserve tail. It cannot prove the exact share attached to every individual rank, which is why we report modelled share of voice rather than reverse-engineered certainty.
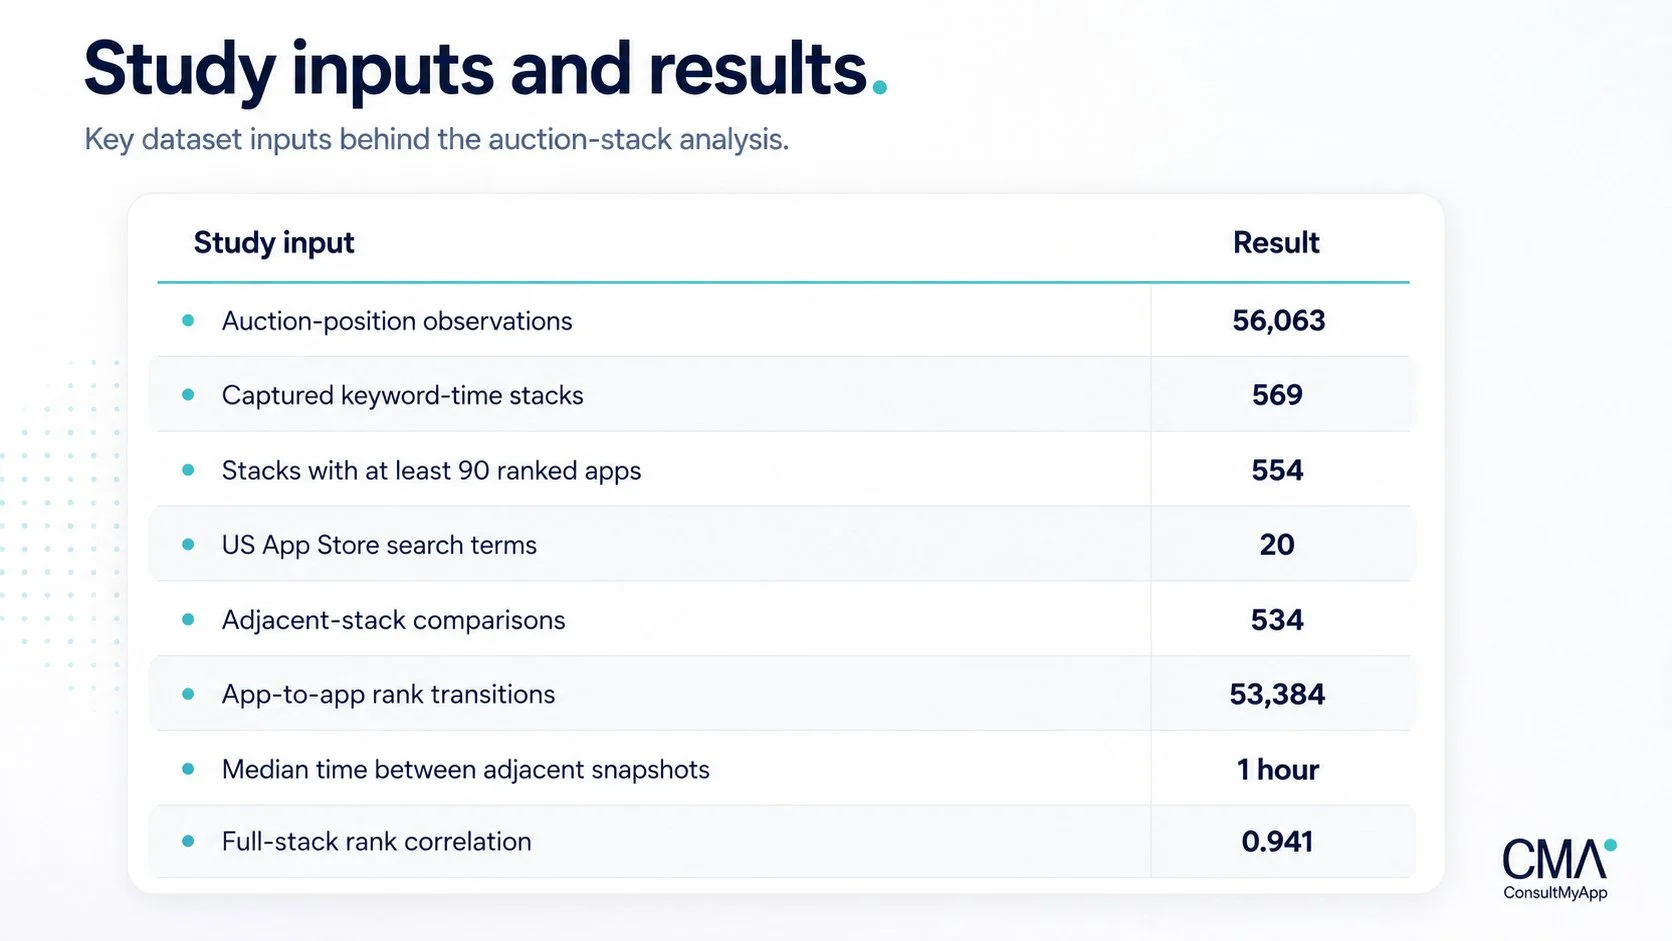
The keyword set is concentrated in a competitive casino and social-casino cluster. Additional verticals will improve generalisability, especially where auction depth and advertiser behaviour differ. However, the rank-movement and retention measures remained stable as the dataset expanded, so broader coverage is more likely to refine the curve than prove something else entirely.
Frequently asked questions about Apple Search Ads share of voice
1. What is Apple Search Ads share of voice?
Apple Search Ads share of voice is the estimated percentage of App Store search ad impressions won by an app for a keyword, market and time period. It is an impression-share measure, not simply the percentage of device screenshots in which the app appeared.
2. How many auction positions should an Apple Ads SoV tool track?
At least the top 50 for a reliable market view. Tracking the full top 100 adds useful reserve-tail and early-discovery data, but the largest accuracy gain comes from moving beyond the visible ads and through the top 50.
3. Do apps below auction position 2 receive impressions?
Yes. Lower-ranked apps repeatedly moved into the top two in the next hourly observation, including 10 promotions from ranks 51-100. Their expected impression share becomes very small, but it is not zero.
4. Why is the top 50 the practical cut-off?
The advertiser set was 90.1% stable at the top 50, compared with 92.3% for the full stack. Top 50 captures most of the meaningful competitive market while avoiding false precision in the thinnest part of the tail.
5. Is the 43% / 35% / 22% split official Apple data?
No. Apple does not publish impression share by hidden auction rank. The split is APPlyzer's central model estimate from the observed stack dynamics and should be used as a defensible market estimate, not an Apple disclosure.
6. What determines Apple Ads auction position?
Apple publicly says whether a search-results ad displays over competitors is determined by app relevance to the query and the keyword bid. Advertisers cannot select or bid directly for a particular ad position.
7. How is APPlyzer different from screenshot (device)-based monitoring?
Screenshot monitoring records the apps that happened to be visible. APPlyzer observes the full auction stack, tracks movement below the visible line and converts position history into estimated share of voice and competitor intelligence.
The bottom line: visible ads are not the full market
Look at positions 1 and 2 and you have a device screenshot. Look at the top 50 and you have a market.