
The Definitive Guide to US App Store Download Trends 2025 to 2026

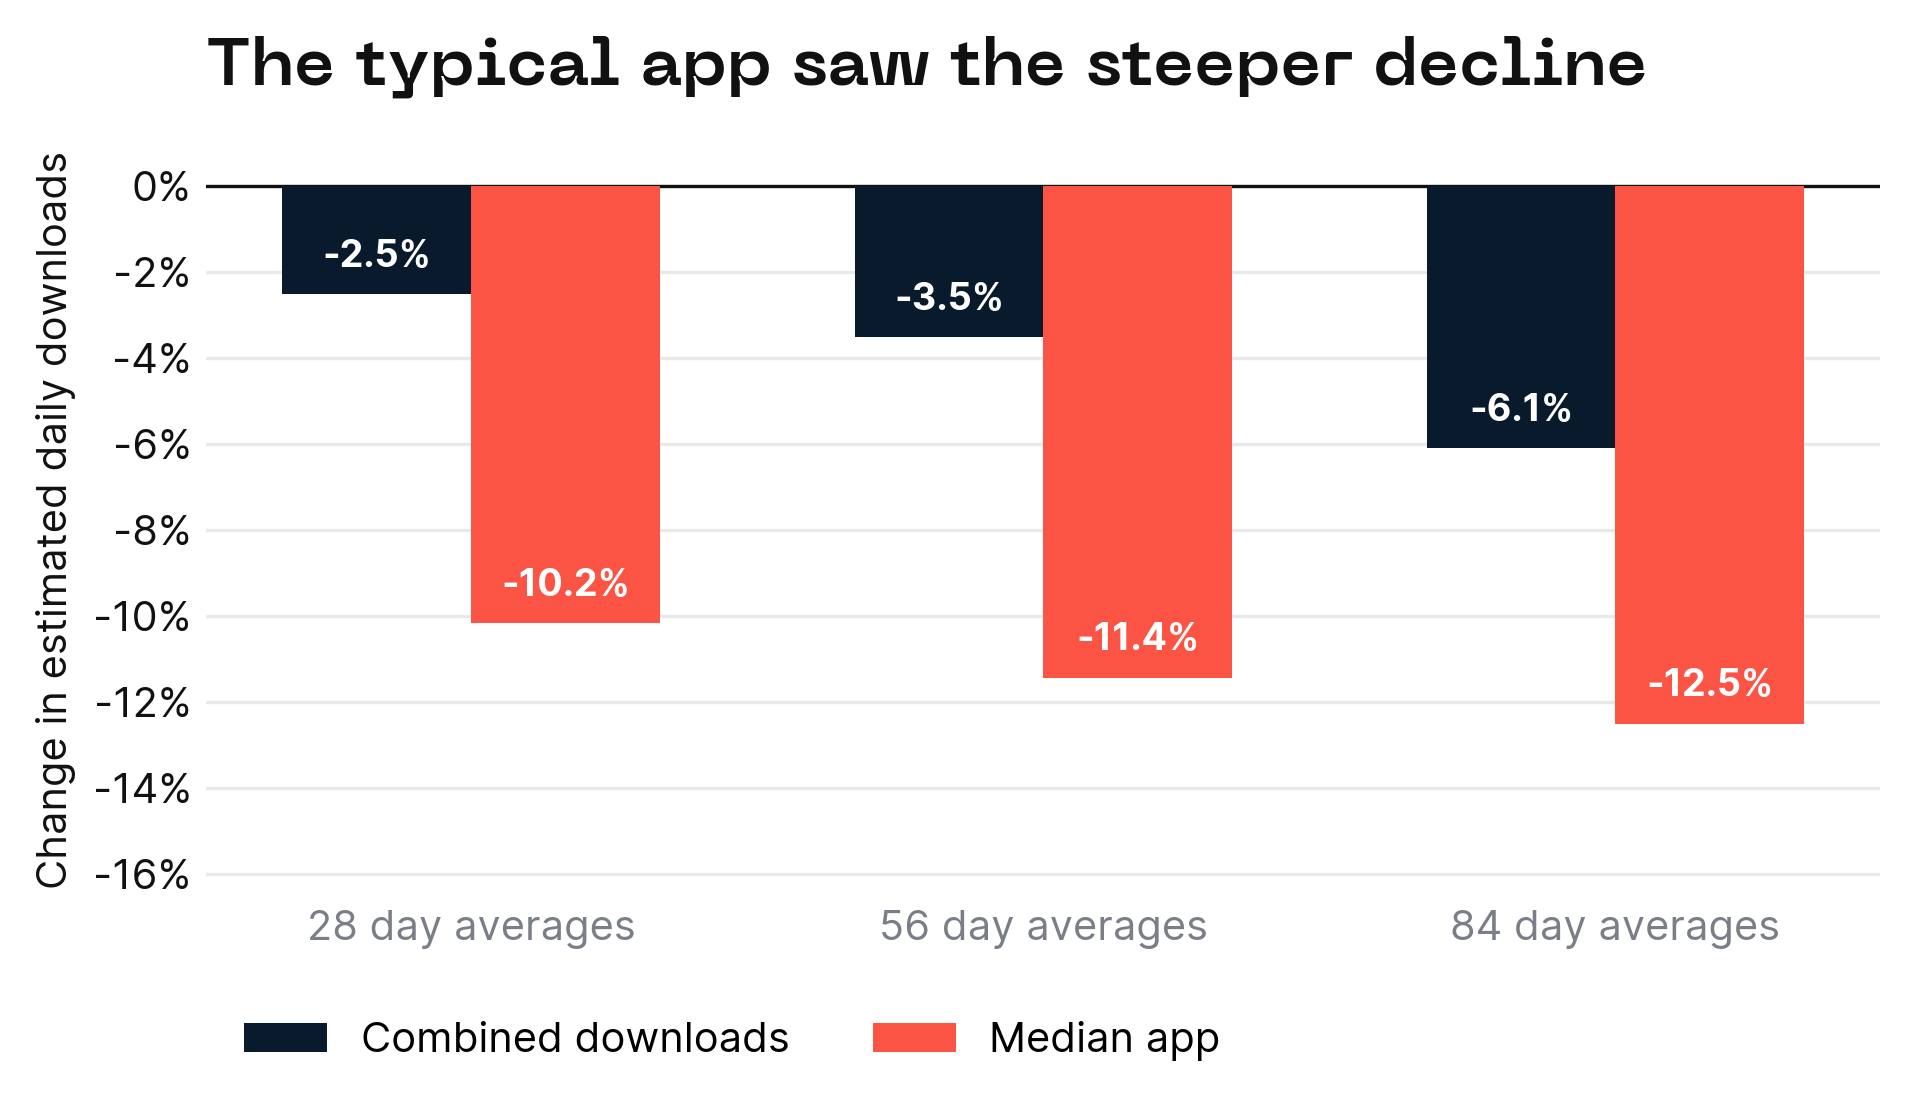
Downloads fell 6.1% across the apps we studied. The typical app fell 12.5%.
Data source: APPlyzer
Last updated: 17th September 2026
US App Store download trends at a glance
If growing your app has felt like hard work lately, these results should make you feel a little less sad...
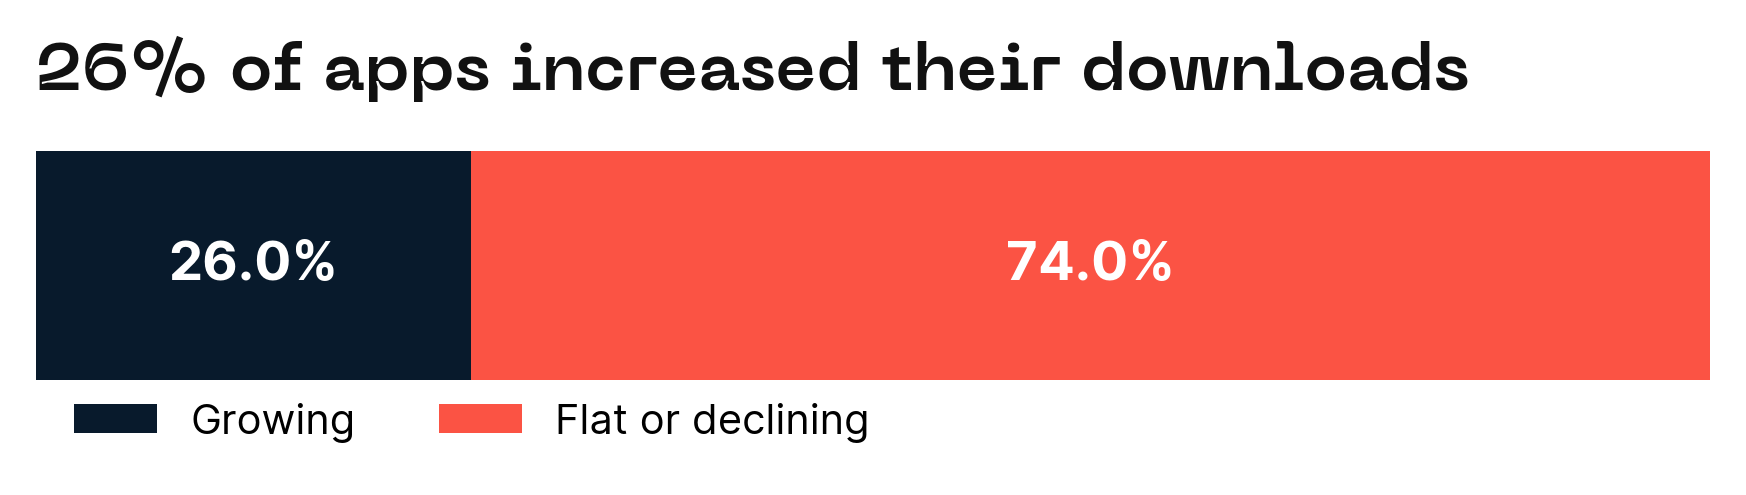
Across the US iPhone apps in our study, estimated daily downloads fell 6.1% between our late 2025 and summer 2026 comparison periods. The typical app fell 12.5%, and 74.0% of apps finished flat or down. That is a fairly awkward backdrop for a meeting about why the growth target needs to be higher.
There was plenty of growth to find, though. Health and fitness performed well across a range of apps. Fashion resale posted a much bigger headline increase, driven by Vinted and Depop. Streaming, social and dating all moved backwards.
We used APPlyzer download estimates to compare a selected group of US iPhone apps. The results show how those apps performed, rather than the growth rate of the entire App Store. Our main comparison uses the first and last 84-day averages, with shorter windows alongside it.

Share of apps by download trend in the main comparison. Source: APPlyzer US iPhone download estimates.
^^The median app fell further in every comparison we made.
Why the overall figure only tells part of the story
The combined download figure gives bigger apps more influence. The median is the middle percentage change when we rank the apps, so it is a useful way to see how the typical app fared.
Here, the difference is substantial. Combined downloads fell 6.1%, but the median app fell 12.5%. Growth was concentrated enough to make the overall picture look considerably cheerier than most apps' dashboards.
How much Vinted and Depop changed the result
Vinted and Depop grew strongly enough to affect the result for the whole study. Including them, combined downloads fell 6.1%. Without Vinted the decline was 8.5%, and without either app it was 10.4%.
That helps explain the gap between the headline and the typical app. A strong performance by a few businesses can lift the group while most of their neighbours are having a rather different year.
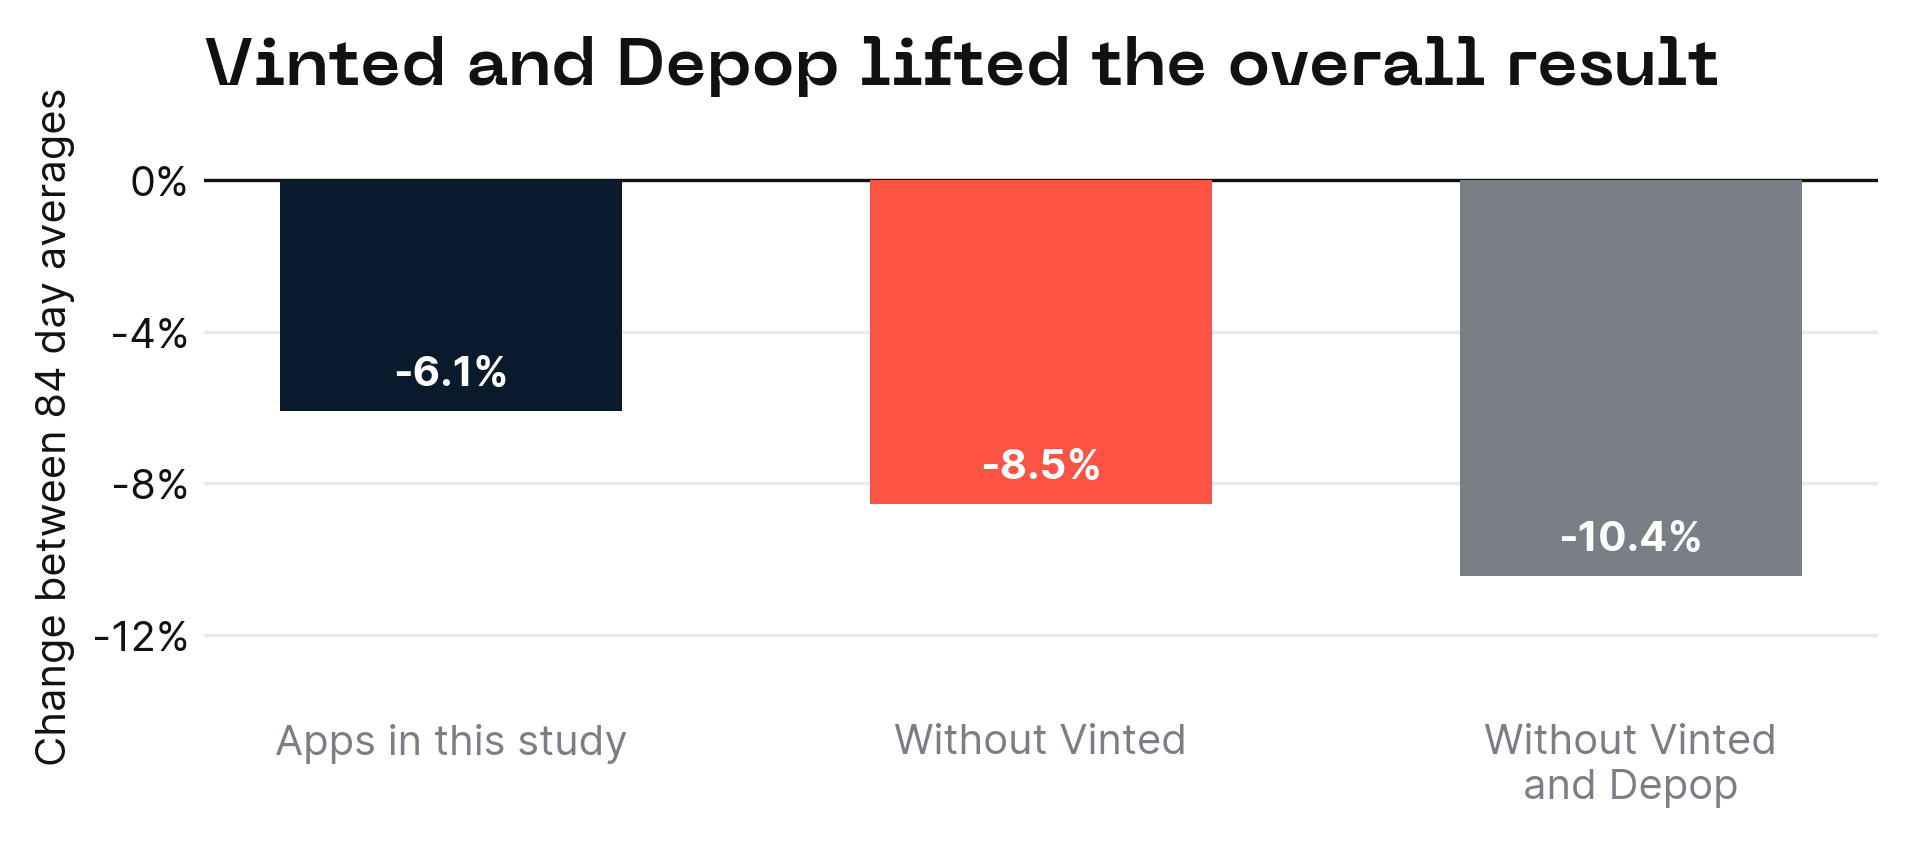
The same comparison with and without the resale leaders shows how much their growth contributed
Which app categories grew and which declined?
Health, Fitness and Wellness led the categories, with downloads up 27.3%. Education and shopping also grew overall, although the median app in each category declined. Streaming finished at the other end of the table, down 15.2%.
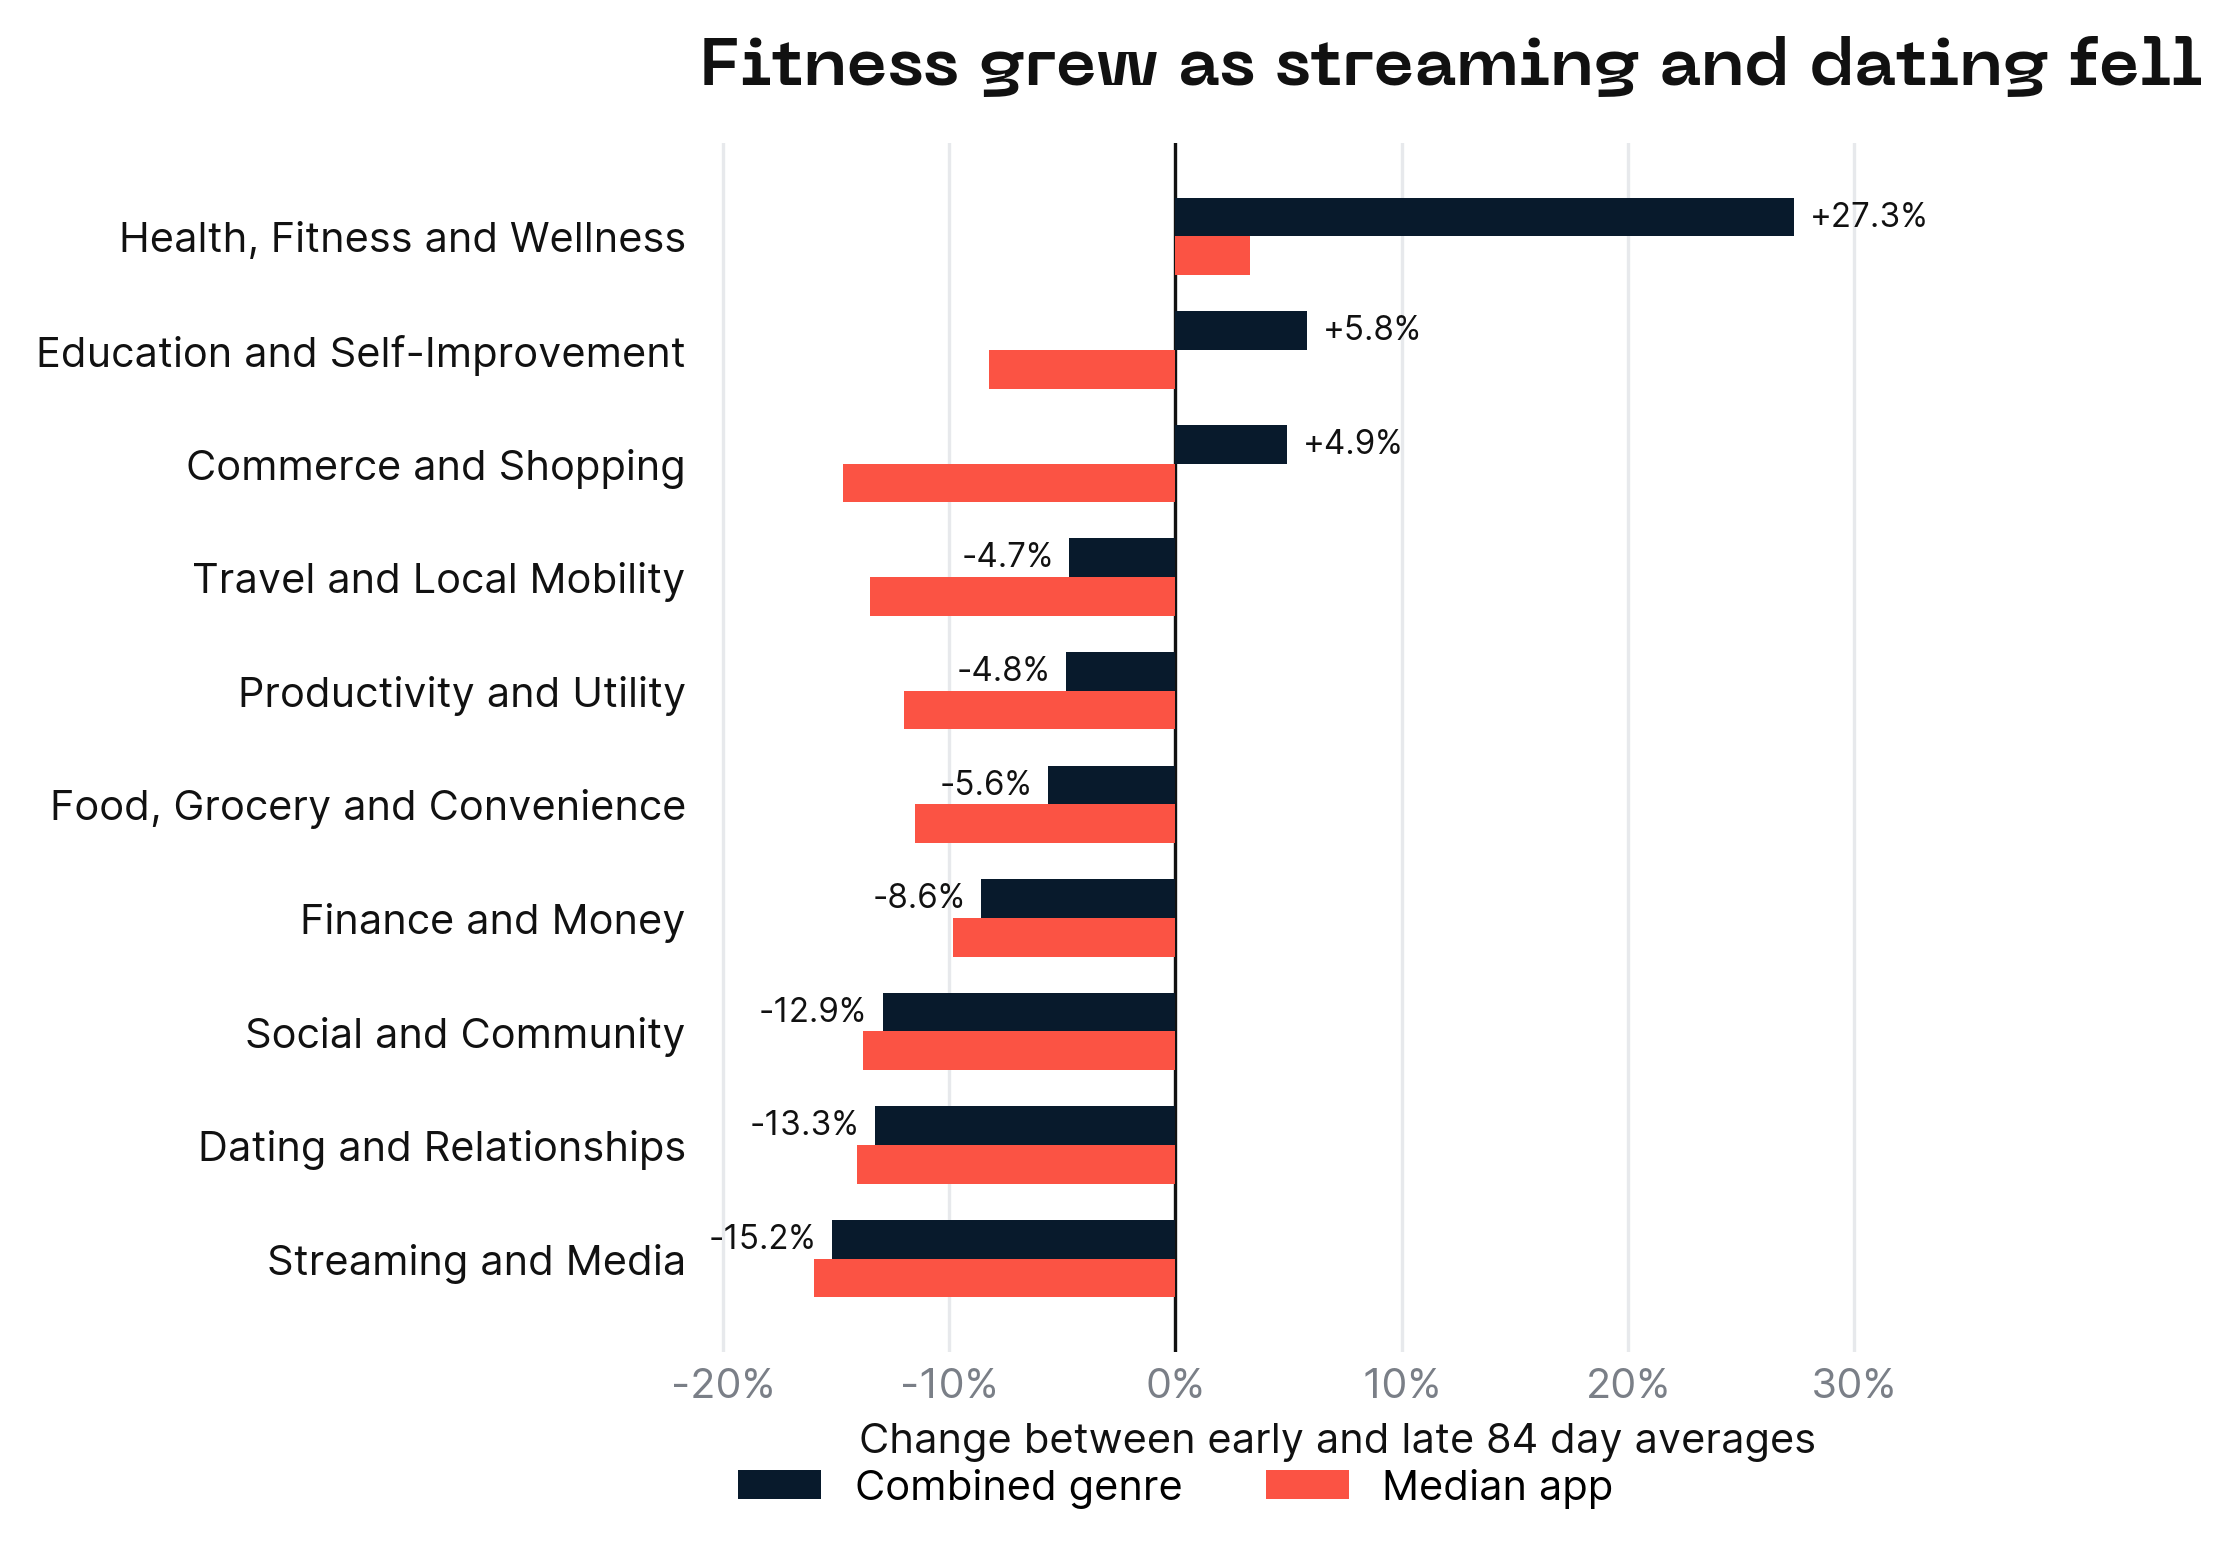
Category results compare the first and last 84-day averages. Source: APPlyzer US iPhone download estimates.
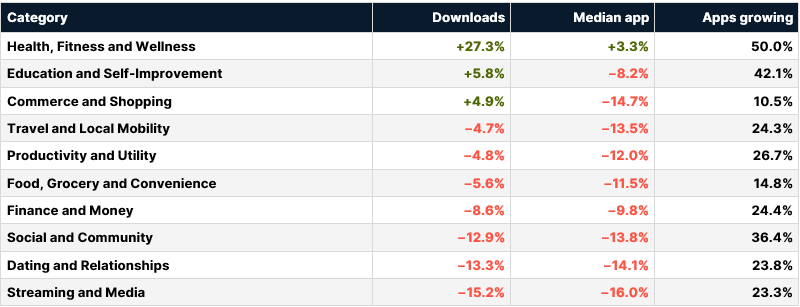
The combined category result is a useful starting point. The median and the percentage of apps growing tell you how widely that performance was shared.
Fitness growth reached beyond the headline apps
Health and fitness was the only category where both combined downloads and the median app grew. Downloads rose 27.3%, the median app gained 3.3%, and 50.0% of apps grew.
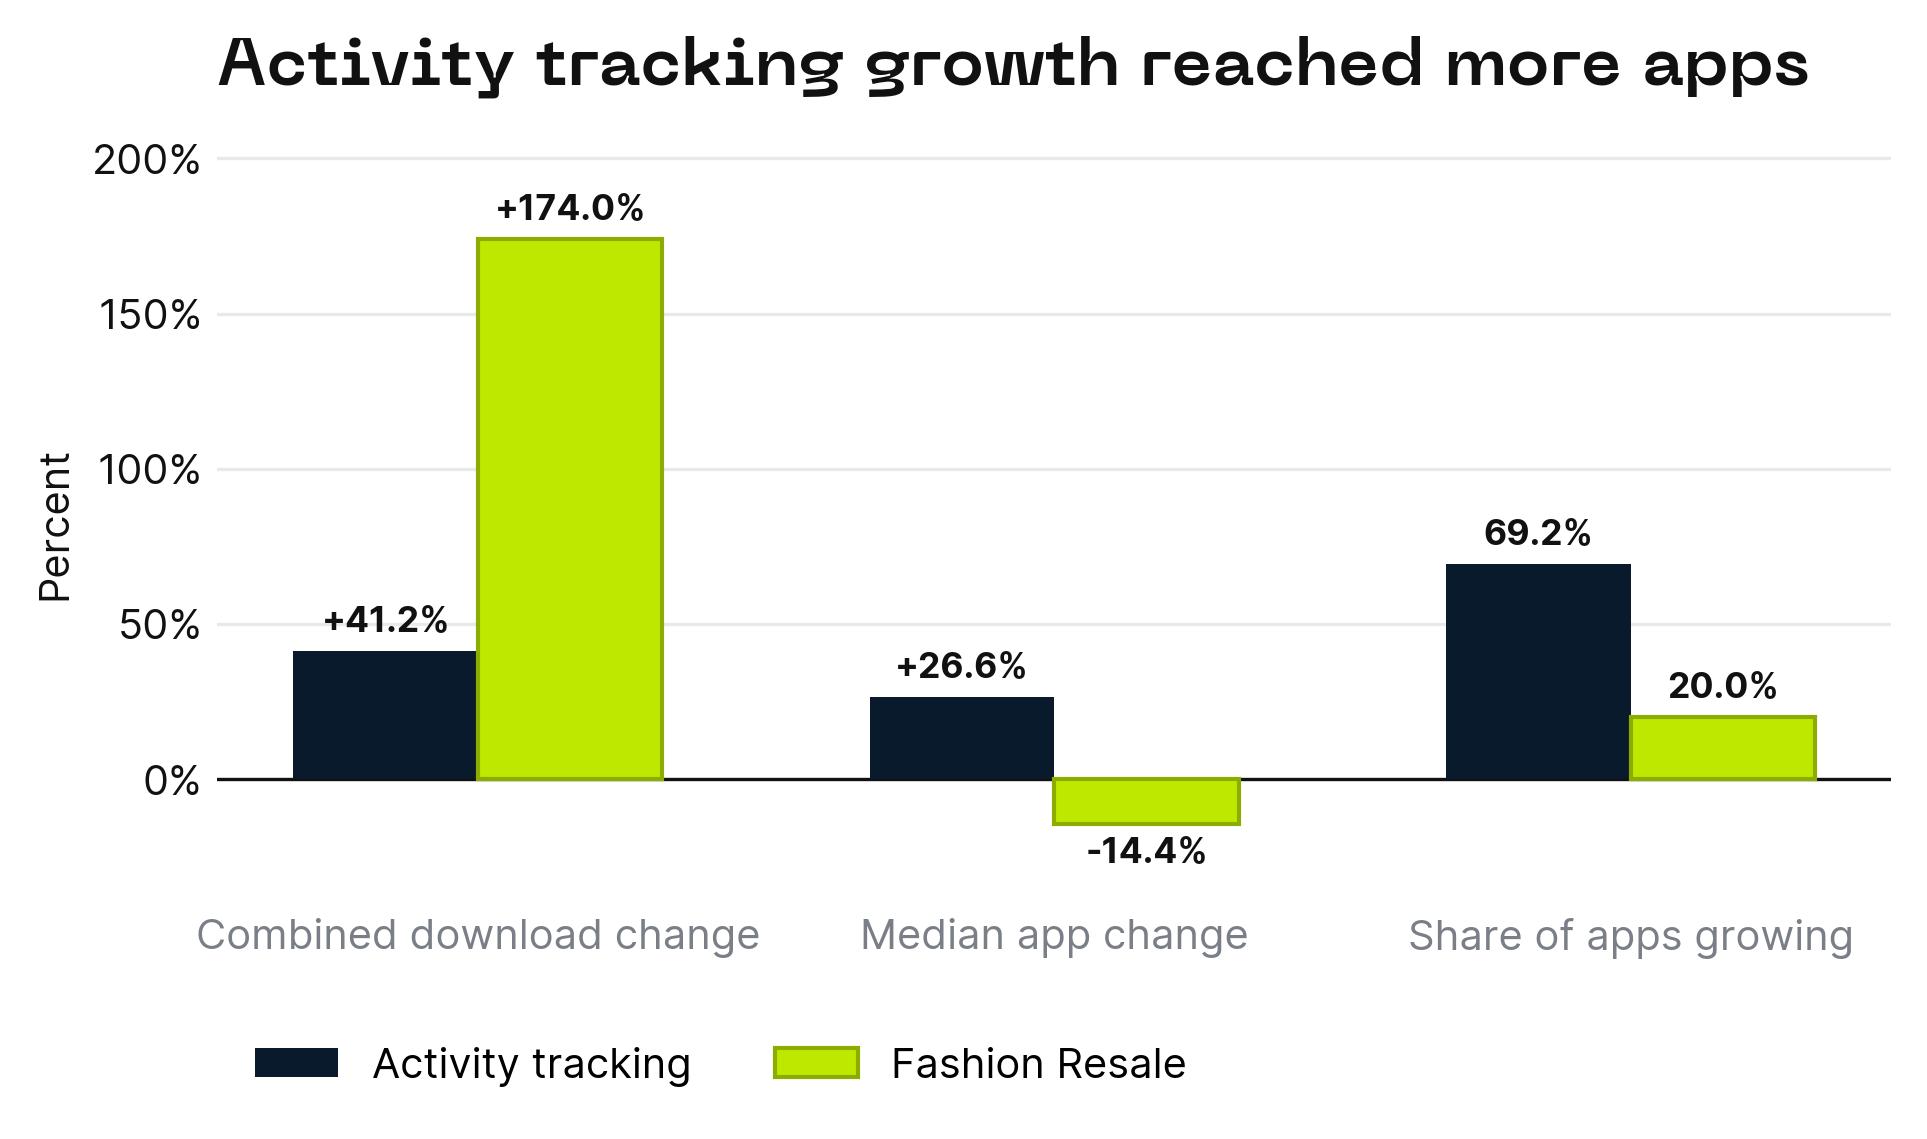
Activity Tracking was stronger still. Downloads increased 41.2%, the median app grew 26.6%, and 69.2% of apps gained ground. MyFitnessPal rose 97.3%, while Strava, AllTrails, Garmin Connect, Oura and WHOOP also grew.
For a marketer in this space, that is encouraging. Growth appeared across a range of products, which makes the category result more useful as a benchmark.
Resale growth belonged to Vinted and Depop
Fashion Resale grew 174.0% in the US. Vinted increased 2,189.4% (admittedly from a smaller starting base), while Depop rose 266.5%. They were the only resale apps whose downloads grew.
Only 20.0% of resale apps grew, and the median app fell 14.4%. The rest of the subgenre, excluding Vinted and Depop, declined 24.5%.
Commerce and Shopping grew 4.9% overall. Most shopping apps would be forgiven for asking when, as only 10.5% grew, and excluding Vinted and Depop the subcategory outcome is a dismal 17.5% decline YoY.
Streaming social and dating lost ground
Streaming growth was harder to find
Streaming and Media downloads fell 15.2%, with the median app down 16.0%. Video Streaming was weaker still, declining 20.5%.
Sling fell 59.9%, Prime Video fell 51.2%, HBO Max fell 37.3% and Netflix fell 19.9%. Tubi moved the other way, growing 29.1%. Music and Audio Streaming declined 5.0% overall, despite Amazon Music growing 78.4%.
There is a useful reminder here for anyone competing with a much larger brand. Familiarity does not guarantee download growth, and a declining category still leaves room for individual apps to do well.
Social apps moved in different directions
Social and Community downloads fell 12.9%. Within that category, Social Networks declined 17.6%, while Short-form Video fell 19.3%.
Lemon8 dropped 68.8%, TikTok fell 40.9% and Instagram declined 26.7%. Meanwhile, Meetup grew 30.9%, Tumblr rose 29.2%, Reddit increased 24.9% and rednote gained 24.0%.
Those results are a good reason to define your competitors properly. An app built around local events does not face exactly the same demand as a video feed, even if both sit under a social heading.
Dating also faced a decline
Dating and Relationships fell 13.3%, while the median app declined 14.1%. A difficult result to dress up with a better profile picture.
PURE grew 82.8%, but Raya fell 51.1% and Plenty of Fish declined 29.5%. Growth was available, although it was far from the typical experience.
The picture across the other categories
Finance and Money declined 8.6%. Retail Investing fell 17.9%, while Consumer Banking was close to flat at +0.4%. Food, Grocery and Convenience fell 5.6%, Travel and Local Mobility declined 4.7%, and Productivity and Utility fell 4.8%.
Education and Self Improvement grew 5.8%, but its median app fell 8.2%. As with shopping, the positive category result did not describe the experience of most apps.
The fastest growing apps and the biggest falls
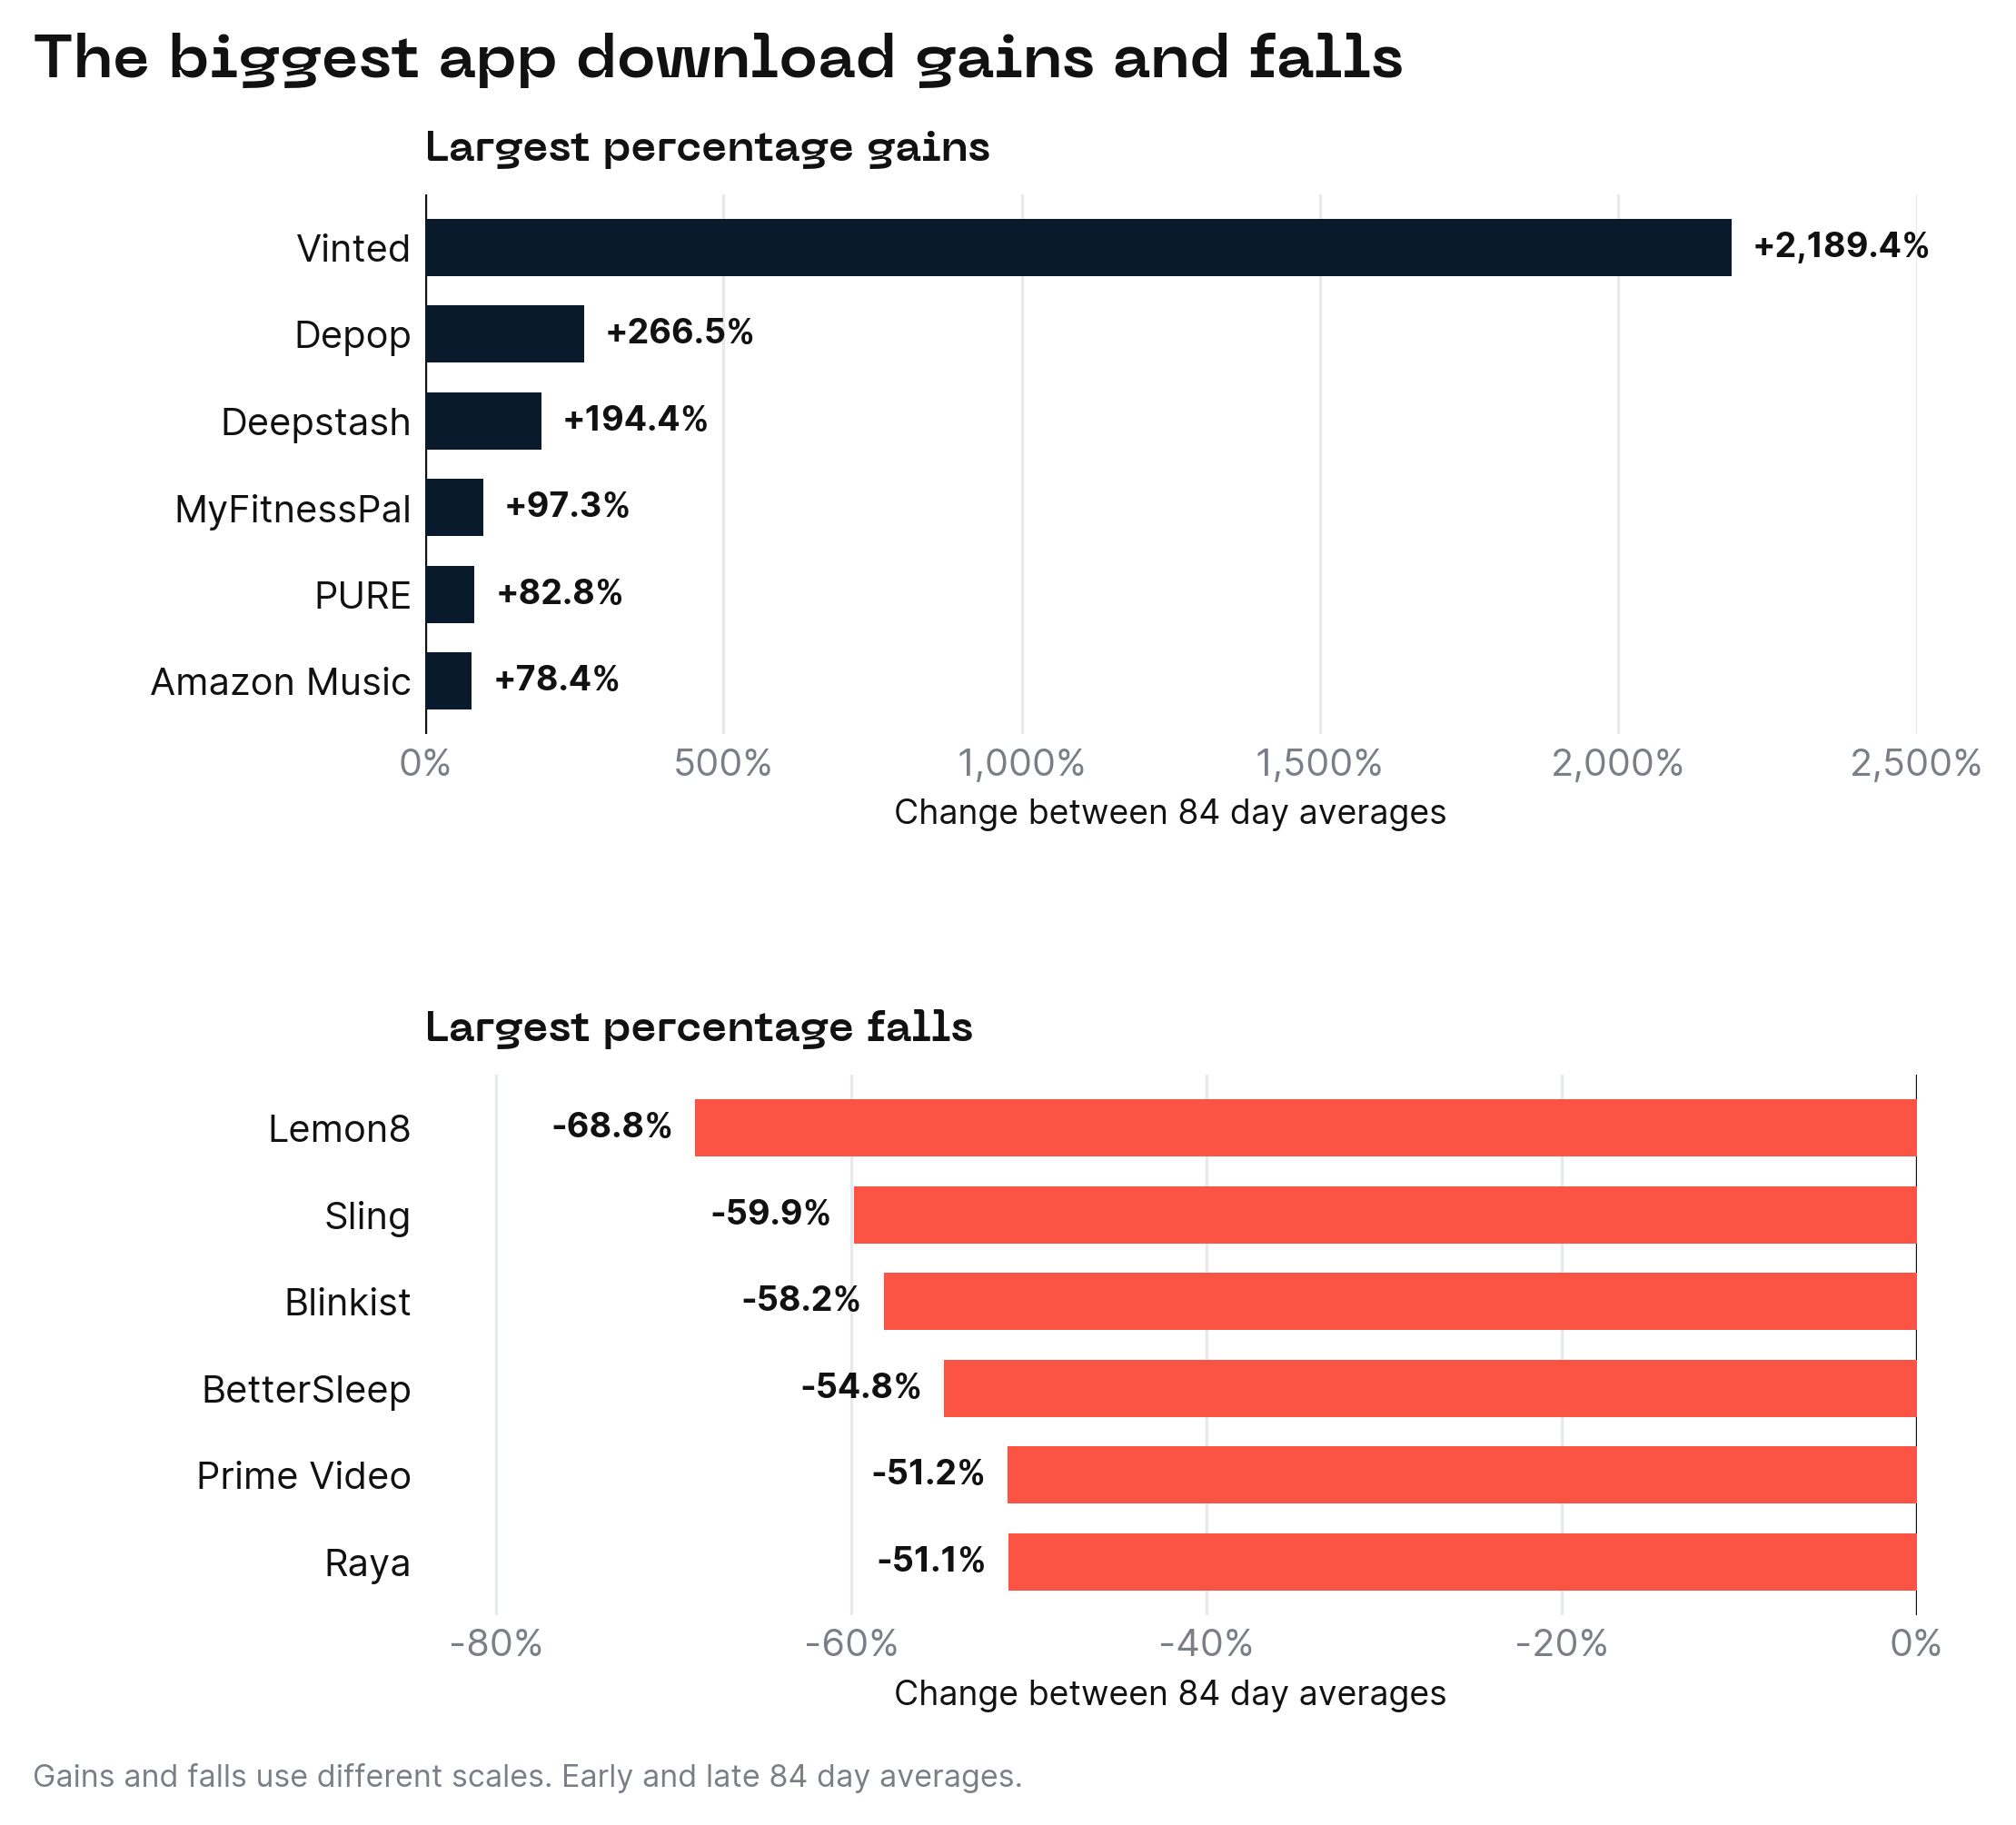
Vinted led percentage growth, followed by Depop and Deepstash. MyFitnessPal, PURE and Amazon Music also stood out. At the other end, Lemon8 and Sling recorded the largest percentage falls.
These rankings compare growth relative to each app's starting level. They tell us who gained or lost ground fastest within the study, rather than which app is the largest.
What this means for your app marketing
The most useful question is where your app sits against businesses competing for similar users. A shopping app falling behind Vinted faces a different problem from a shopping app keeping pace with its closest competitors in a declining part of the market.
Choose a benchmark that fits your app
Start with the subgenre and then narrow the comparison to the apps your customers actually consider. Activity Tracking and sleep apps are different propositions. So are local communities and short-form video feeds. A category average can hide those differences.
If your plan says 'we're in a growing category', this is probably a good time to add another sentence. The resale results show why.
Investigate what the winners are doing
Use the growing apps as a starting point for research. Look at how they position themselves in the store, which search terms they appear for and how their creative presents the product. Check whether changes in visibility line up with changes in downloads.
A download chart cannot tell you whether a campaign, a product change or seasonality caused the result. That needs its own investigation before you start spending money on someone else's apparent winning formula.
Keep acquisition and customer value connected
Download growth tells us about acquisition. It does not tell us whether those users stay, pay or cost too much to acquire. Use this research alongside your conversion, retention and revenue data when deciding what to scale.
In a weaker category, improving store conversion or retaining more of the users you already attract may be particularly useful. In a growing one, check whether your app is capturing its share of that growth.
Look beyond the category average
Across the apps in this study, the headline decline was 6.1%, while the typical app fell 12.5%. Fitness offered the clearest example of growth being shared across products. Resale showed how exceptional results from Vinted and Depop could lift a category in which most apps declined.
Before using a market trend to set your next target, look at who actually benefited from it. That should lead to a much more useful conversation than simply asking everyone to make the graph go up.
How we measured app download growth
The study uses APPlyzer download estimates for a selected group of 284 US iPhone apps (across a wide array of categories) from 4 September 2025 to 31 August 2026. It compares average daily downloads at the beginning and end of that period.

We use the 84-day averages for the main findings because they reduce the influence of short bursts. These are comparisons between the opening and closing periods, rather than calendar-year totals or like-for-like year-on-year growth.
The figures describe the apps in this study and should not be used as the growth rate of the whole US App Store. They are APPlyzer estimates, rather than downloads reported by the publishers themselves.
Common questions about the findings
Which app category grew fastest?
Health, Fitness and Wellness led the main categories at +27.3%. Fashion Resale had the largest subgenre increase at +174.0%, while Activity Tracking showed more widely shared growth at +41.2%.
Which apps grew fastest?
Vinted, Depop and Deepstash had the largest percentage increases among the apps in the main comparison, at +2,189.4%, +266.5% and +194.4% respectively.
Why did the typical app fall further?
Strong growth from a small group of apps offset declines elsewhere in the combined figure. The median gives each app equal weight, so it better reflects the typical percentage result.
If you’d like to talk to our mobile experts about how CMA leverage some of the world’s most advanced data, models, tech & AI to drive market-beating results for our clients, we’d love to hear from you, so please reach out!