Apple Search Ads Data Shows Google Gemini’s App Store Takeover Attempt🤯
Apple Search Ads Data usually tells a pretty tidy story: brand defence, a few generics, maybe some competitor conquesting, plus a long-tail discovery layer.
But December 2025 was different. Google’s Gemini looked like it hit the “show up everywhere” button and let the Apple Search Ads auctions sort it out 🔥 By our estimates, they spent at least $11m in just 2 weeks doing this!
And this is where the data gets fun… because most tools only show you who won. APPlyzer shows you the full Apple Search Ads auction results across positions #1 to #5 (not just the winner), so you can actually see blanket coverage happening in real time ✅
What we saw in the Apple Search Ads Data 👀
Using APPlyzer’s Gemini dataset (covering 14 Dec 2025 → 14 Jan 2026), the footprint is honestly ridiculous.
Keywords observed: 66,200 🤯
Active keywords (14 Dec): 66,200
Active keywords (31 Dec): 40,648
Active keywords (14 Jan): 8,484 (huge pullback)
“Aligned/relevant” keywords share (AI / Google / productivity): ~4.1%
Top 2 “average auction positions” share: ~36.2%
Average auction positions #4–#5 share: ~44.4% (classic blanket behavior, bidding just to be present rather than trying to own the terms)
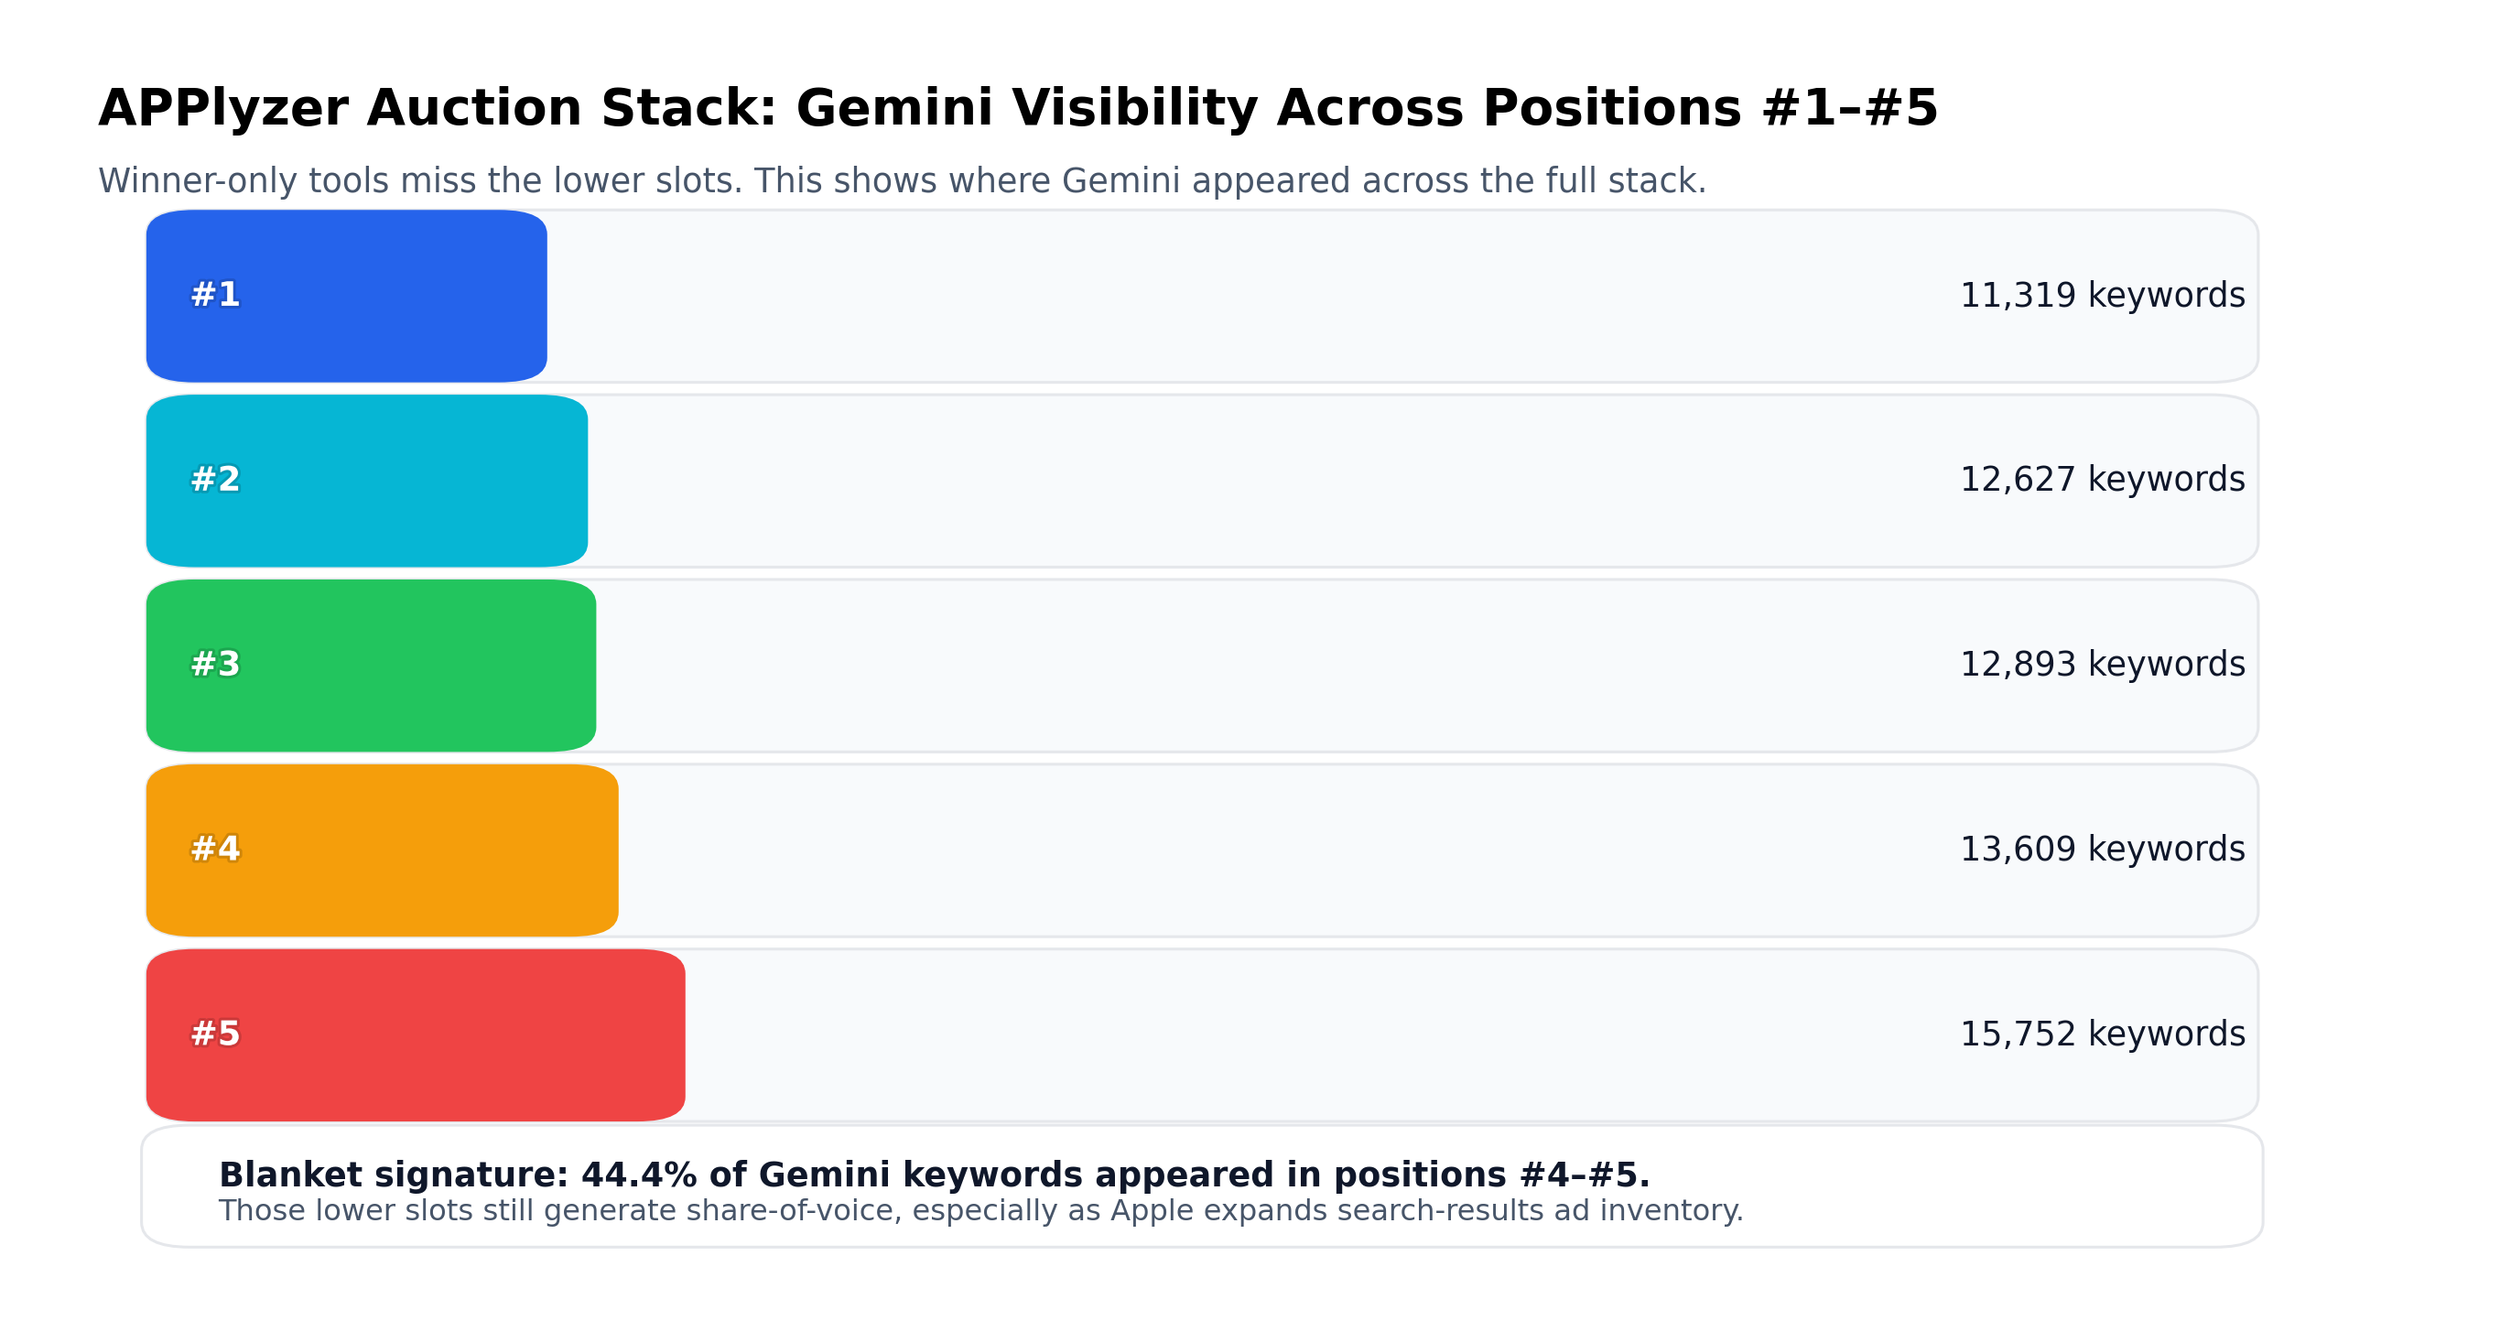
My take: this wasn’t built like a normal “efficient acquisition” ASA account. This looks like a visibility land-grab 👑
The giveaway: “average auction positions” (and why the data matters here) 🎯
In this dataset, the position is an average auction position. That’s important because it means Gemini wasn’t just popping in occasionally… it was repeatedly appearing in the auction stack.
And the big tell is the heavy weight in average auction positions #4 and #5.
If you only see winners, you miss most of this story.
If you can see positions #1 to #5, you can see the “always present” strategy clearly.
Full auction visibility (using the data from APPlyzer) is exactly what lets you measure this properly. You can see where your bid actually lands, where competitors land, and how often you are “almost winning” (or quietly blanketing) ✅
Why this must have cost a fortune (at least $11m anyway…) 💸
Two reasons blanket coverage gets expensive fast:
Demand: higher-demand keywords require higher bids to compete.
Relevancy: when a keyword doesn’t match your app well, Apple’s auction tends to require you to bid harder just to show.
So when you see broad coverage across loads of unrelated categories, you’re basically watching someone pay for presence.
The calculations…
Adding all daily search volumes from APPlyzer across all active keywords for 14–31 Dec (18 days), this gives:
✅ ~108.2M estimated ad impressions (for that 18-day window)
Step 2: Convert impressions → taps → spend
Taps = impressions × TTR
Spend = taps × CPT
Base case (TTR 3.5%, CPT $3.00):
108.2M × 3.5% = ~3.79M taps
3.79M × $3.00 = ~$11.4M total (≈ $0.63M/day!!)
Could Apple have supported this with credits because of wider strategic alignment? Maybe. But even with discounts, the scale of coverage screams urgency. This looks like a brand trying to be “everywhere” while the AI category fight heats up 🚀
Really odd keywords 🤨
This is the part where you stop and go… “wait, why is Gemini showing up there?”
Here are a few examples from the dataset that feel wildly off-brand for an AI assistant (and yes, these were showing with measurable average auction positions):
netflix (avg auction position ~3)
ig (avg auction position ~3)
amazon prime video (avg auction position ~4)
hbo max (avg auction position ~4)
paramount+ (avg auction position ~4)
prime video (avg auction position ~5)
max (avg auction position ~3)
panda express (avg auction position ~4)
Ultra-short generics like m and tr (which are usually chaos terms)
Could you build an argument for one or two of these? Sure. But in bulk, it looks like a deliberate “own the shelf” play rather than a tight intent strategy.
What app marketers should steal from this 🧠
Even if you’re not Google, this is a genuinely useful Apple Search Ads Data lesson:
Blanket coverage is measurable if you can see auction depth. Winner-only views hide it.
Average auction positions tell you intent: lots of #4–#5 presence often means “visibility” not “efficiency”.
ASA + ASO needs to be one workflow. Otherwise you can burn budget and accidentally pay for installs you would have earned organically.
Final thought 🔥
If you want a single headline takeaway from this Gemini moment:
Apple Search Ads Data is no longer just “did I win?”
It’s now “where do I sit across the whole auction stack, and what does that mean for spend, placements, and my organic visibility?”
If you want to see that properly, you need full auction visibility (which you’ll also need to prepare for the new ad placements in March 2026!). Your trusty data platform companion for all of this has to be APPlyzer - this is really what it was built for ✅
FAQ: Apple Search Ads Data 🙋♂️🙋♀️
How do I see apple search ads auction results?
You need a platform that captures the full Apple Search Ads auction results, not just the winner. In practice, that means visibility into positions #1 to #5.
APPlyzer is currently the only Apple Search Ads Data platform we’re aware of that provides this full auction-stack view (positions #1 to #5) at keyword level, so you can see where your bids are actually landing and exactly who you’re up against ✅
What's a good platform for managing ASA with ASO?
If you’re running ASA without ASO context, you’re flying half-blind. The best setup is one place that shows:
Apple Search Ads Data (including average auction positions)
Organic rankings and keyword visibility
Competitor behaviour (including CPP and creative patterns)
APPlyzer was built for exactly that combined workflow, and it’s designed in conjunction with award-winning ASO marketers from ConsultMyApp. So it’s not “generic dashboard software”, it’s built by people who actually run ASO programs at scale 💪
Want the full ASO feature rundown? You can read more at applyzer.com ✅
What Apple Search Ads Data is available?
It depends on the platform, but in APPlyzer you can access Apple Search Ads Data and App Marketing Data that supports real decision-making, including:
Full auction results across positions #1 to #5 (so you see the whole stack, not just winners)
Daily search impression volumes (keyword demand proxy)
Organic keyword rankings (so you can connect paid and organic)
Competitor visibility and keyword overlap
Custom Product Pages (CPP) tracking and competitive CPP usage
In-App Events tracking (where relevant)
Broader ASO + market context data designed for practical workflows
How do I use Apple Search Ads data with organic (ASO)
This is where the money is. Here are two simple, high-impact plays:
1) Spot cannibalisation and reduce wasted bids 📉
If you’re already ranking top 10 organically on a keyword and you’re also showing in a high average auction position (say #1–#2), you might be paying for installs you would have gotten anyway.
In APPlyzer you can line up organic rank + average auction position + demand, then test bid reductions where overlap is high.
Keep brand defence where it’s needed, but don’t blindly overpay for “free” organic traffic.
2) Identify competitor threats before new placements push you down ⚠️
As Apple expands Search Results ad inventory, the “almost winners” matter more.
Competitors sitting in average auction positions #2 or #3 today are prime candidates to pick up delivery in expanded placements.
That can push organic results down, even if your ASO is strong.
In APPlyzer you can see exactly which competitors are sitting behind you in the auction stack, and which of your keywords are most at risk ✅